What is Click-Through Rate?
Click-Through Rate (CTR) is the percentage of people who click a link after seeing it. CTR applies across paid search, display advertising, email campaigns, and organic search results. It is one of the most widely used indicators of whether your messaging is resonating with your audience.
Click-Through Rate Formula
How to calculate Click-Through Rate
Paid ad example: Your display ad is shown 5,000 times and receives 100 clicks.
CTR = 100 / 5,000 = 2%
Email example: Your campaign delivers 1,600 emails and generates 200 clicks.
CTR = 200 / 1,600 = 12.5%
A 2% CTR on a display ad is strong. A 12.5% CTR on an email campaign indicates highly engaged subscribers.
Explore Click-Through Rate sample data
This visualization is a live embed from Klipfolio PowerMetrics.
Start tracking your Click-Through Rate data
Use PowerMetrics, modern analytics platform, to monitor your data. Choose a service below to start tracking your Click-Through Rate instantly.





What is a good Click-Through Rate benchmark?
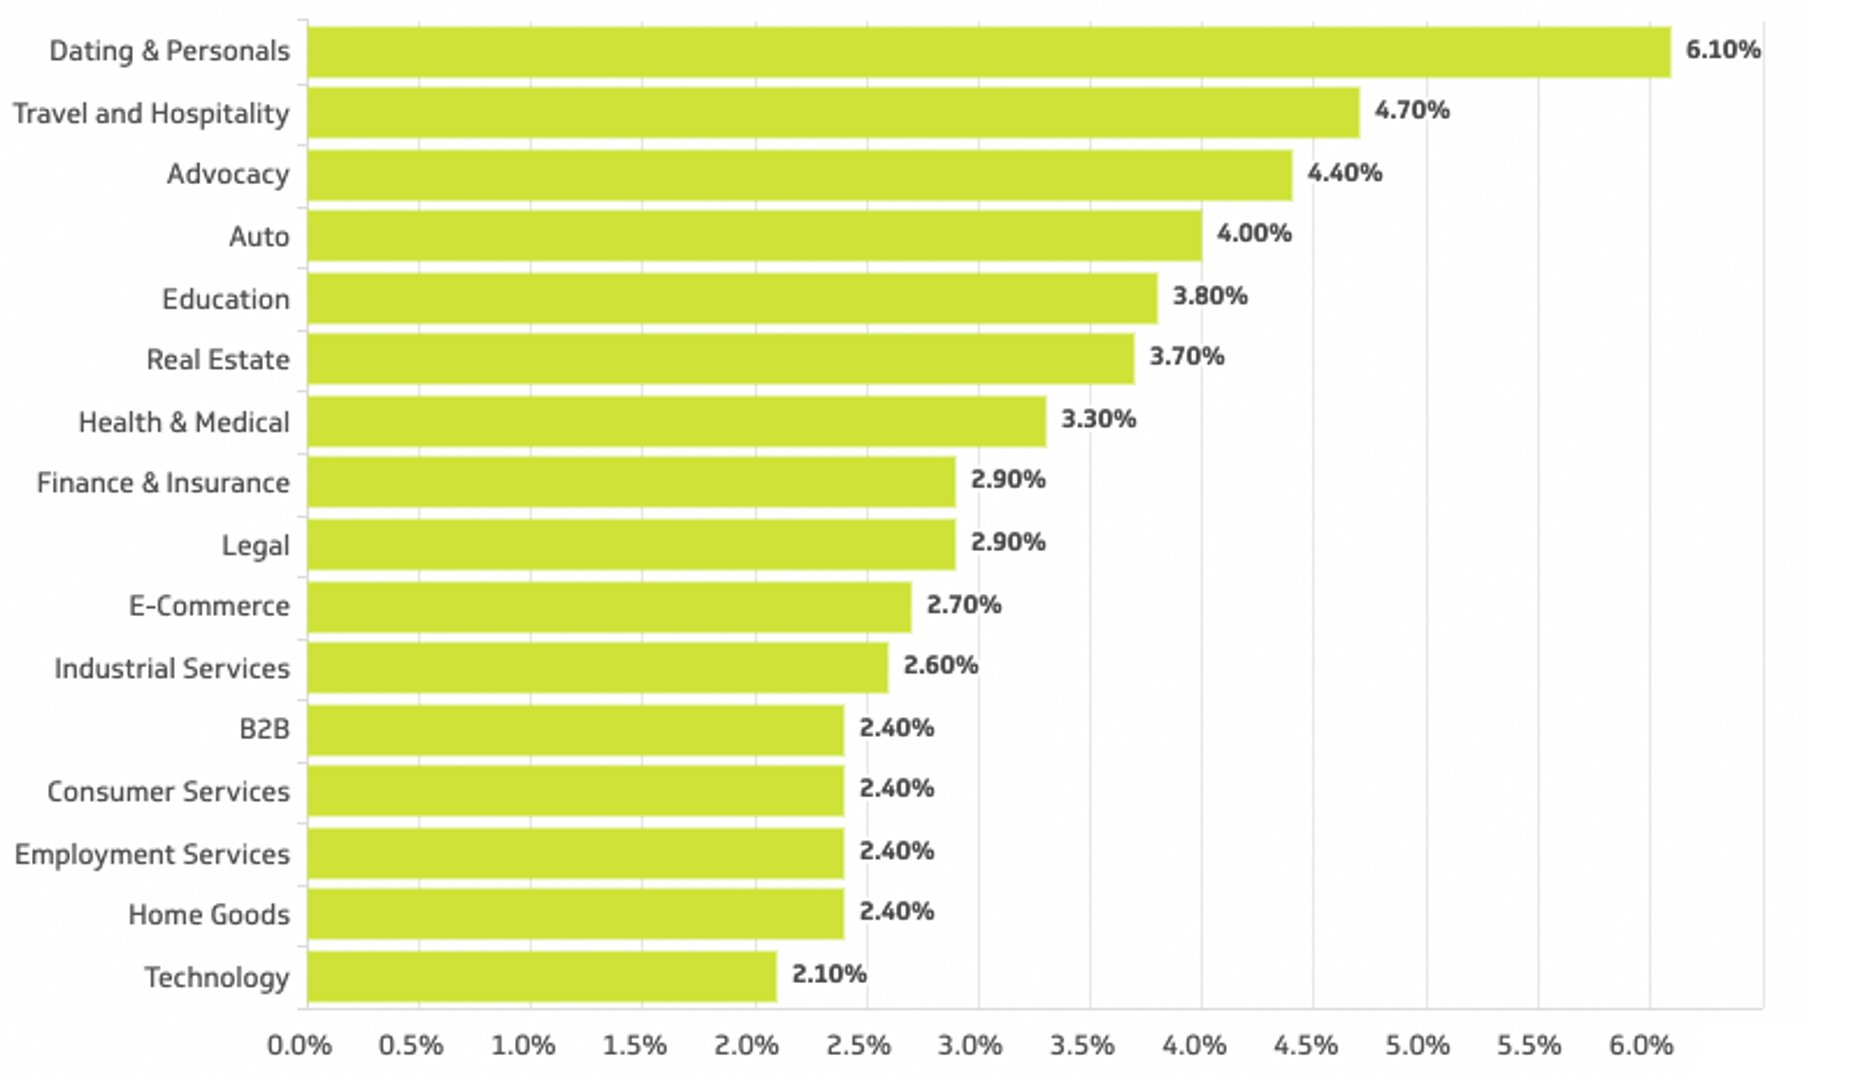
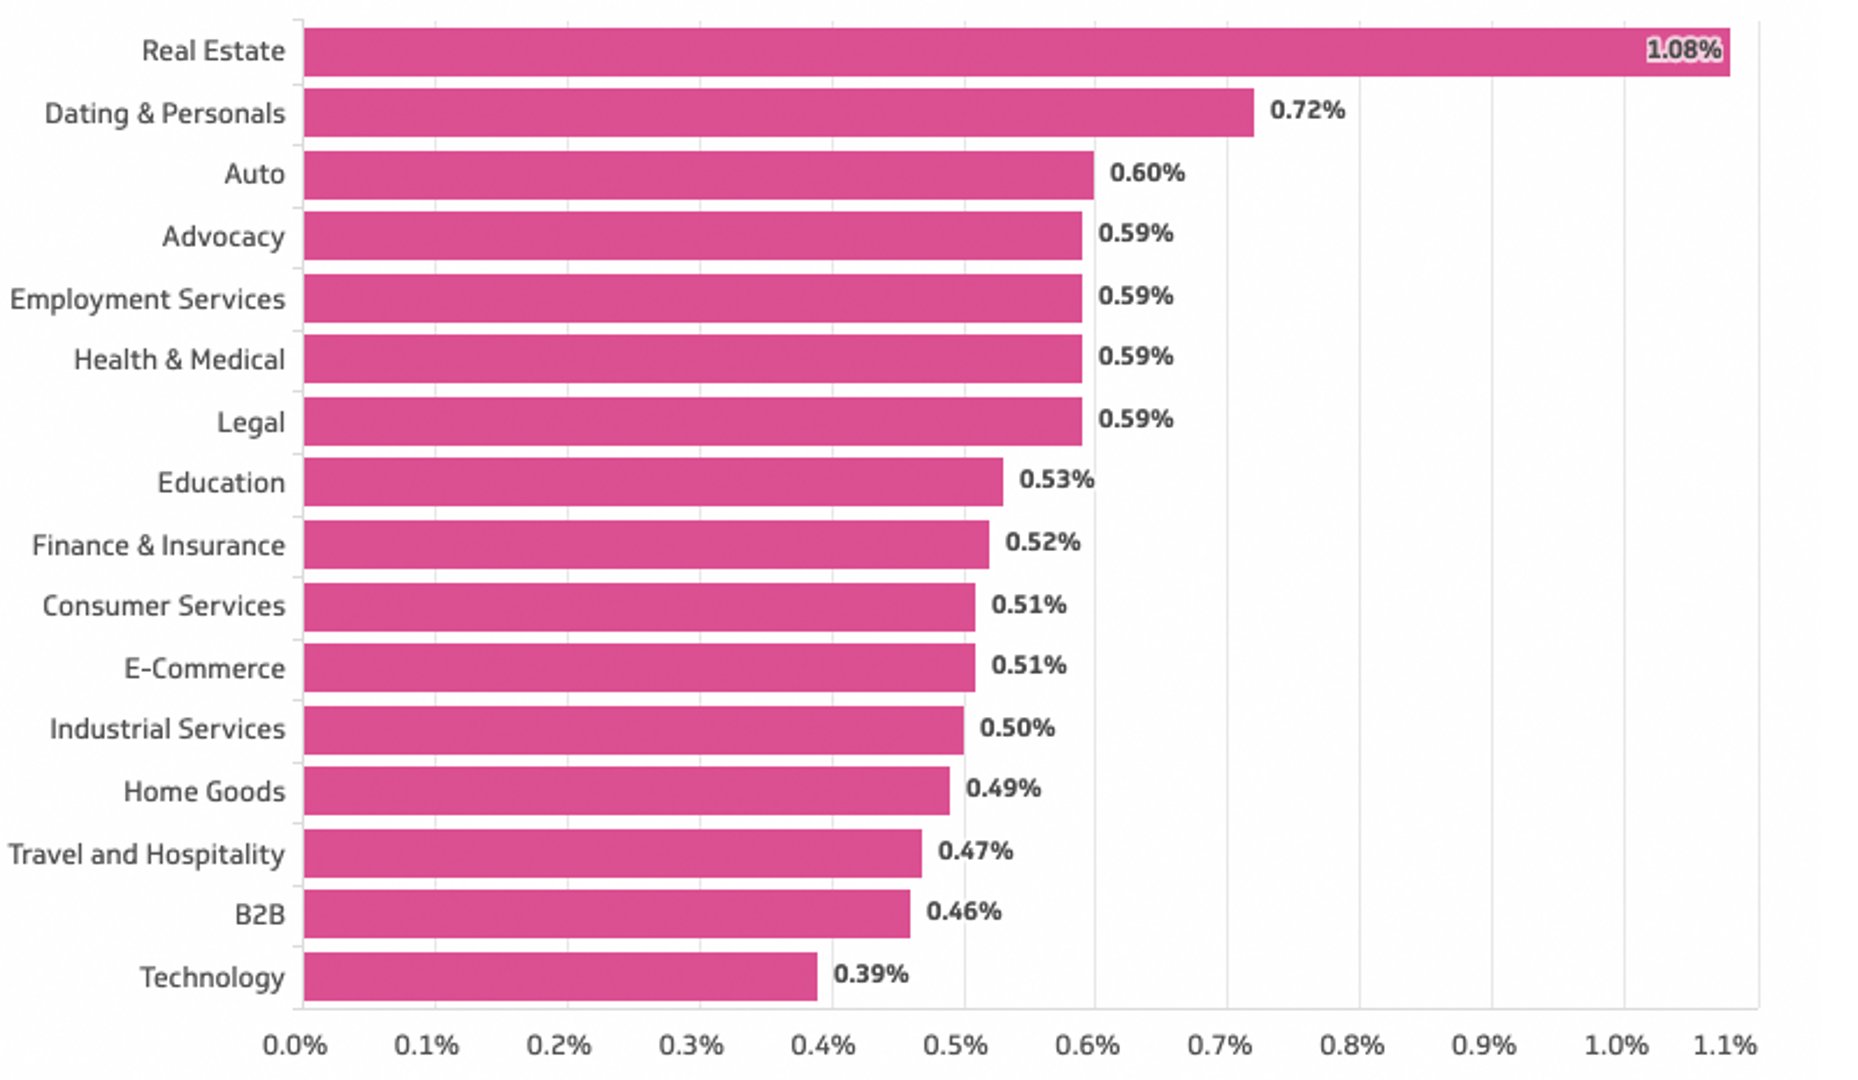
CTR benchmarks vary by channel and format. Typical ranges: display advertising 0.1%–0.5%; paid search 2%–10%+; email marketing 1%–5% (B2C) and 2%–5% (B2B); organic search position 1 can exceed 30%. Sources: WordStream (2024), Mailchimp Email Marketing Benchmarks (2024), Backlinko CTR Study (2024).
Click-Through Rate benchmarks
Click Through Rate (Search) by Industry
Click Through Rate (Display) by Industry
How to visualize Click-Through Rate?
The best way to visualize CTR is either with a line chart to identify changes in the trend or a summary chart to compare the current value to a previous time period. You can also segment your CTR by ad campaign to identify he best and worst performers.
Click-Through Rate visualization examples
Click-Through Rate

Line Chart
Here's an example of how to visualize your Click-Through Rate data in a line chart over time.
Summary Chart
Here's an example of how to visualize your current Click-Through Rate data in comparison to a previous time period or date range.
More about Click-Through Rate
Using CTR effectively
CTR tells you whether your creative, copy, and targeting are working together. A high CTR signals that your audience finds your message relevant. A low CTR points to a mismatch between what you are offering and what your audience expects.
CTR also has downstream effects:
Paid search: Higher CTR improves your Quality Score in platforms like Google Ads, which can lower your cost per click and improve ad placement.
Email marketing: Strong CTR indicates your subject line attracted the right audience, and your email content delivered on that promise.
SEO: Organic CTR from search results reflects how well your title tag and meta description compete for attention.
Treat every campaign as a test
CTR is most valuable when you use it to learn. Run A/B tests on headlines, calls to action, images, and audience segments. Small copy changes can produce meaningful CTR differences. Track what works and apply those lessons to future campaigns.
Follow through on the promise
A high CTR is only half the equation. If users click through and the landing page does not deliver on the expectation set by the ad or email, you will see high bounce rates and low conversions. CTR and conversion rate should always be reviewed together.
Segment by channel and audience
Avoid averaging CTR across channels. A 1% CTR on a display campaign may be excellent; the same rate on a paid search campaign warrants investigation. Segment your reporting by channel, device, audience, and placement to get an accurate picture.
Watch for click fatigue
Audiences exposed to the same creative repeatedly will click less over time. Monitor CTR trends across campaign duration. A declining CTR on a running campaign often signals it is time to refresh creative or rotate messaging.
CTR vs. conversion rate
CTR measures interest. Conversion rate measures action. Both matter, and neither tells the full story alone.
A campaign with a high CTR but low conversion rate suggests your ad is compelling but your landing page is not. A campaign with a low CTR but high conversion rate may be reaching a narrow but highly qualified audience. Use both metrics together to diagnose where your funnel is working and where it needs attention.
Common mistakes when measuring CTR
Ignoring impression quality: A high CTR on low-quality impressions (bot traffic, irrelevant placements) inflates the metric without reflecting real audience interest. Audit your traffic sources regularly.
Benchmarking across channels: Comparing email CTR to display CTR is not meaningful. Always benchmark within the same channel and format.
Optimizing for CTR alone: Chasing a higher CTR without tracking post-click behaviour can waste budget. Clicks that do not convert do not grow your business.
Neglecting negative CTR trends: A steady decline in CTR over a campaign's life often goes unnoticed until budget is exhausted. Set up alerts or review cadences to catch drops early.
Click-Through Rate Frequently Asked Questions
What is a good click-through rate?
A good CTR depends on the channel. Display advertising typically sees 0.1%–0.5%, paid search 2%–10%+, and email marketing 1%–5% for B2C and 2%–5% for B2B. Always benchmark within the same channel and format rather than comparing across them.
What is the difference between CTR and conversion rate?
CTR measures the percentage of people who click a link after seeing it. Conversion rate measures the percentage of those visitors who complete a desired action after clicking. CTR reflects interest; conversion rate reflects outcome.
How do you improve click-through rate?
Test your headlines, calls to action, and visuals through A/B testing. Improve audience targeting so your message reaches people with genuine intent. Ensure your ad or email copy sets an accurate expectation for what users will find after clicking.