Say your website gets 10,000 sessions per week. Out of these, 4,000 sessions are single-page sessions where visitors land on your blog or other pages of your website, read the content, and exit without interacting further. Assuming every session outside of these 4,000 sessions have more than one interaction event take place, your bounce rate would be 4,000 / 10,000 which equals a bounce rate of 40%.
Website Bounce Rate
Last updated: Mar 28, 2024
What is Website Bounce Rate?
Website Bounce Rate measures the percentage of website sessions that are single-page sessions. A single-page session is when a user exits a website after interacting with a single page only. Interactions, also called Engagement Hits or interaction events by Google Analytics, can include: page views, social shares, e-commerce transactions, CTA interactions, and more.
Alternate names: Bounce RateWebsite Bounce Rate Formula
ƒ Count(Single-Page Sessions
Description: A session is a group of user interactions with a website that occur within a defined timeframe. Analytics platforms define a session as a period of continuous engagement that begins when a user arrives and ends after 30 minutes of inactivity or when the user leaves. Each session can contain multiple interactions, including page views, events, downloads, form submissions, and e-commerce transactions. Sessions are fundamental to understanding user behaviour patterns and website performance, capturing the complete journey a user takes during a single visit.
) / Count(SessionsDescription: A session is a group of user interactions with a website that occur within a defined timeframe. Analytics platforms define a session as a period of continuous engagement that begins when a user arrives and ends after 30 minutes of inactivity or when the user leaves. Each session can contain multiple interactions, including page views, events, downloads, form submissions, and e-commerce transactions. Sessions are fundamental to understanding user behaviour patterns and website performance, capturing the complete journey a user takes during a single visit.
)How to calculate Website Bounce Rate
Start tracking your Website Bounce Rate data
Use PowerMetrics, modern analytics platform, to monitor your data. Choose a service below to start tracking your Website Bounce Rate instantly.

What is a good Website Bounce Rate benchmark?
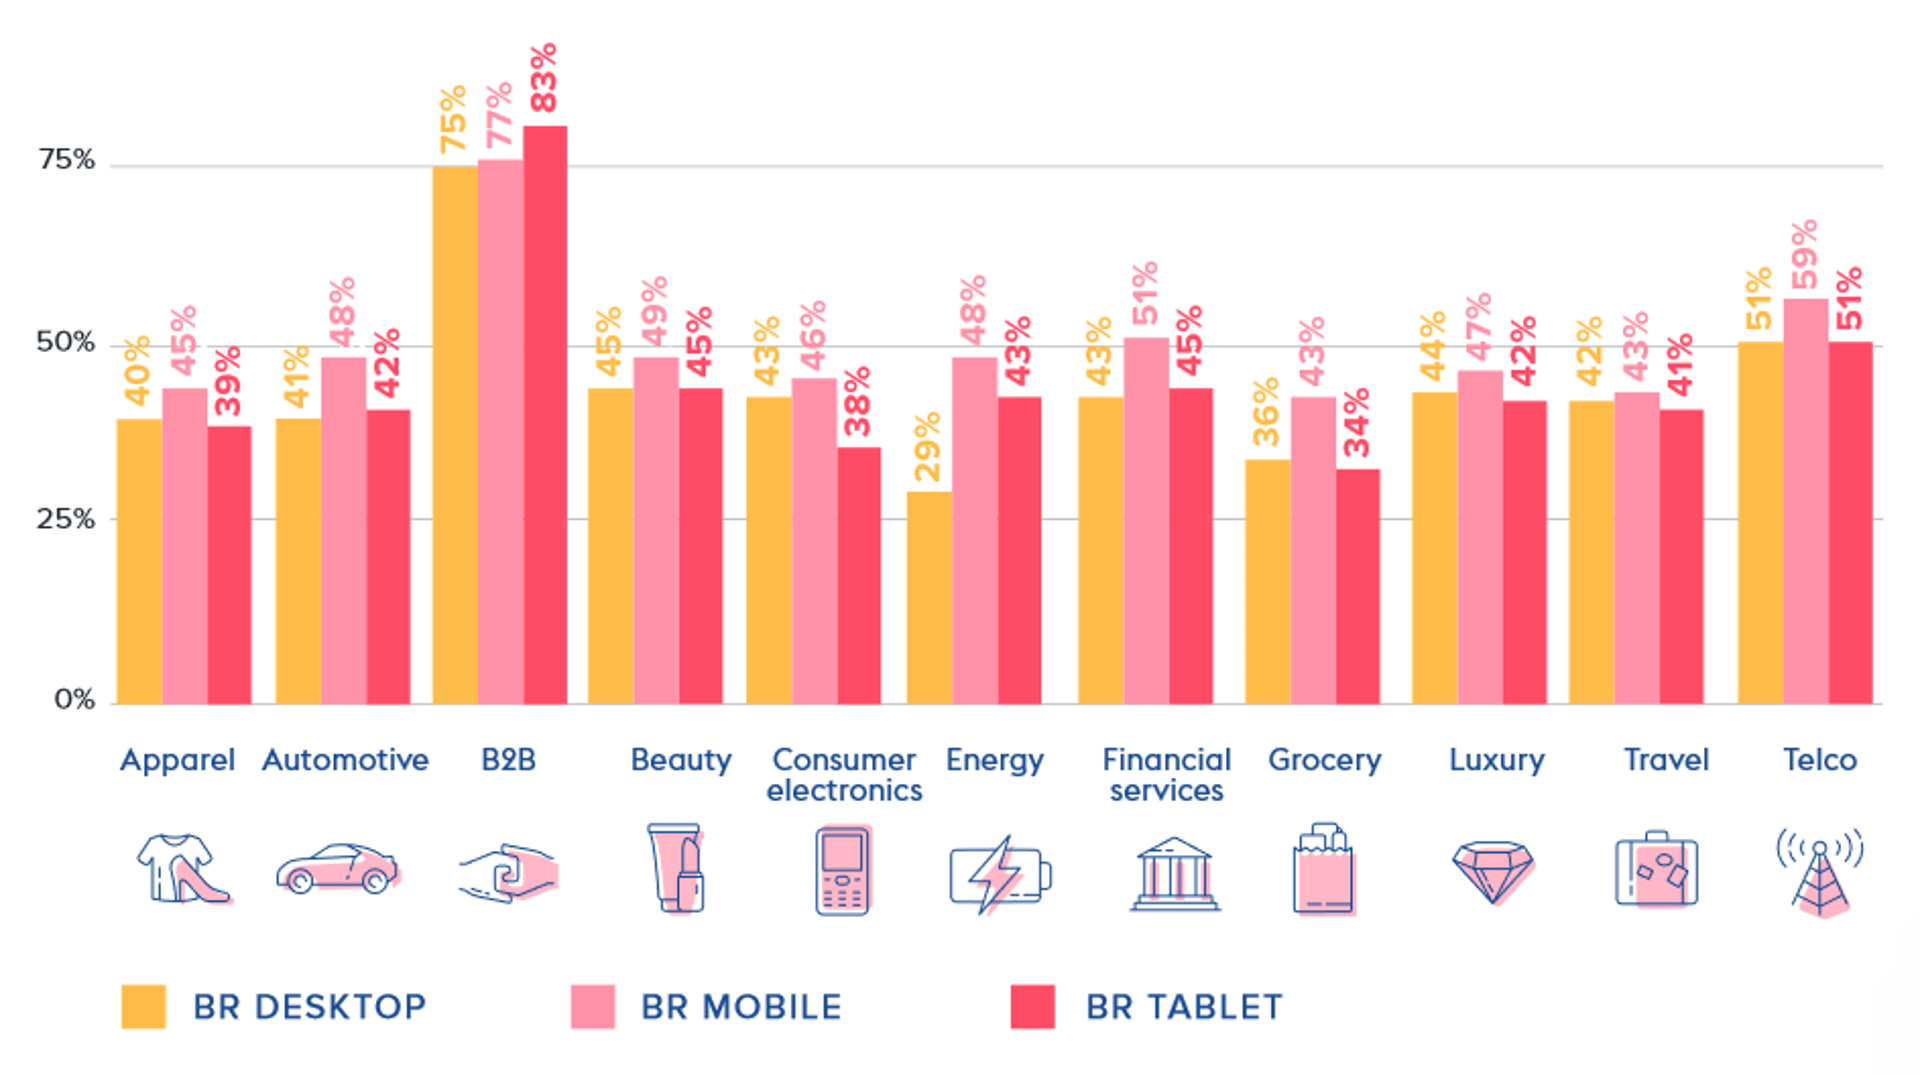
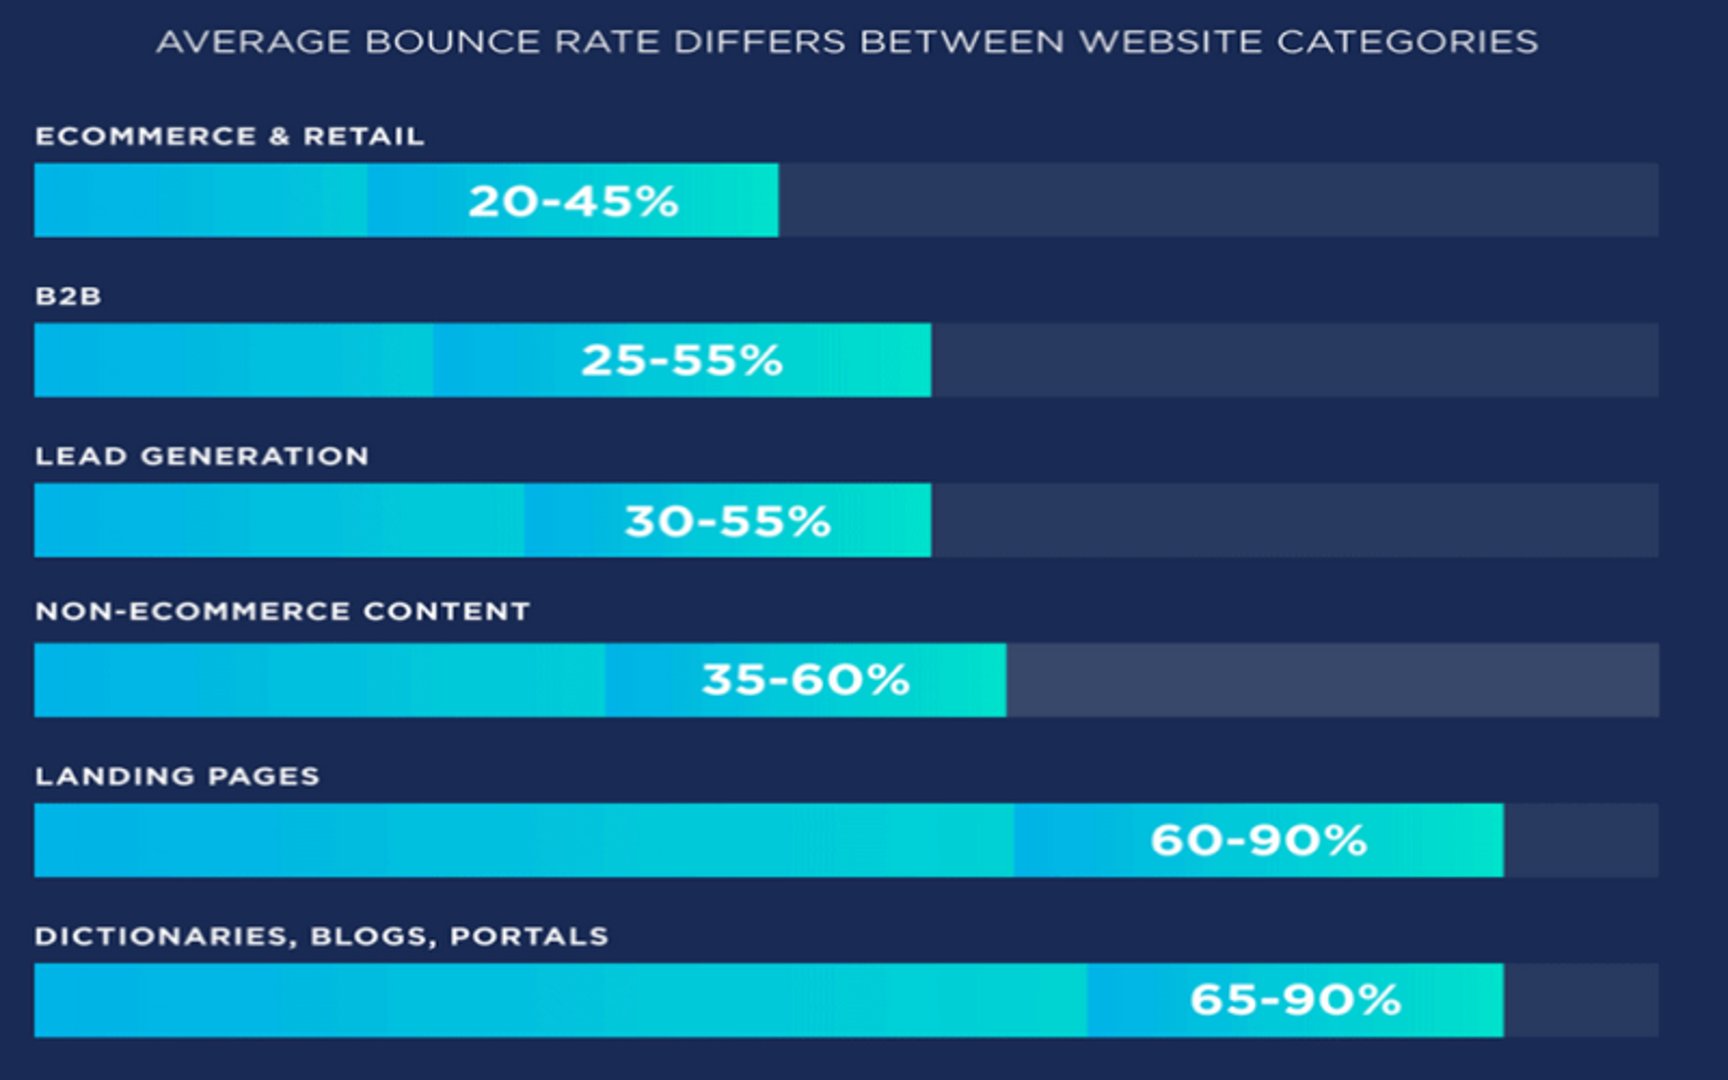
On average, Bounce Rate is 47% across all industries and highest for B2B at around 75% - 83%. Website Bounce Rate also varies based on website categories, and can be as high as 90% for dictionaries, blogs, or journalistic content.
Website Bounce Rate benchmarks
Bounce Rate Benchmark by Industry and Device Type

Bounce Rate by Website Category

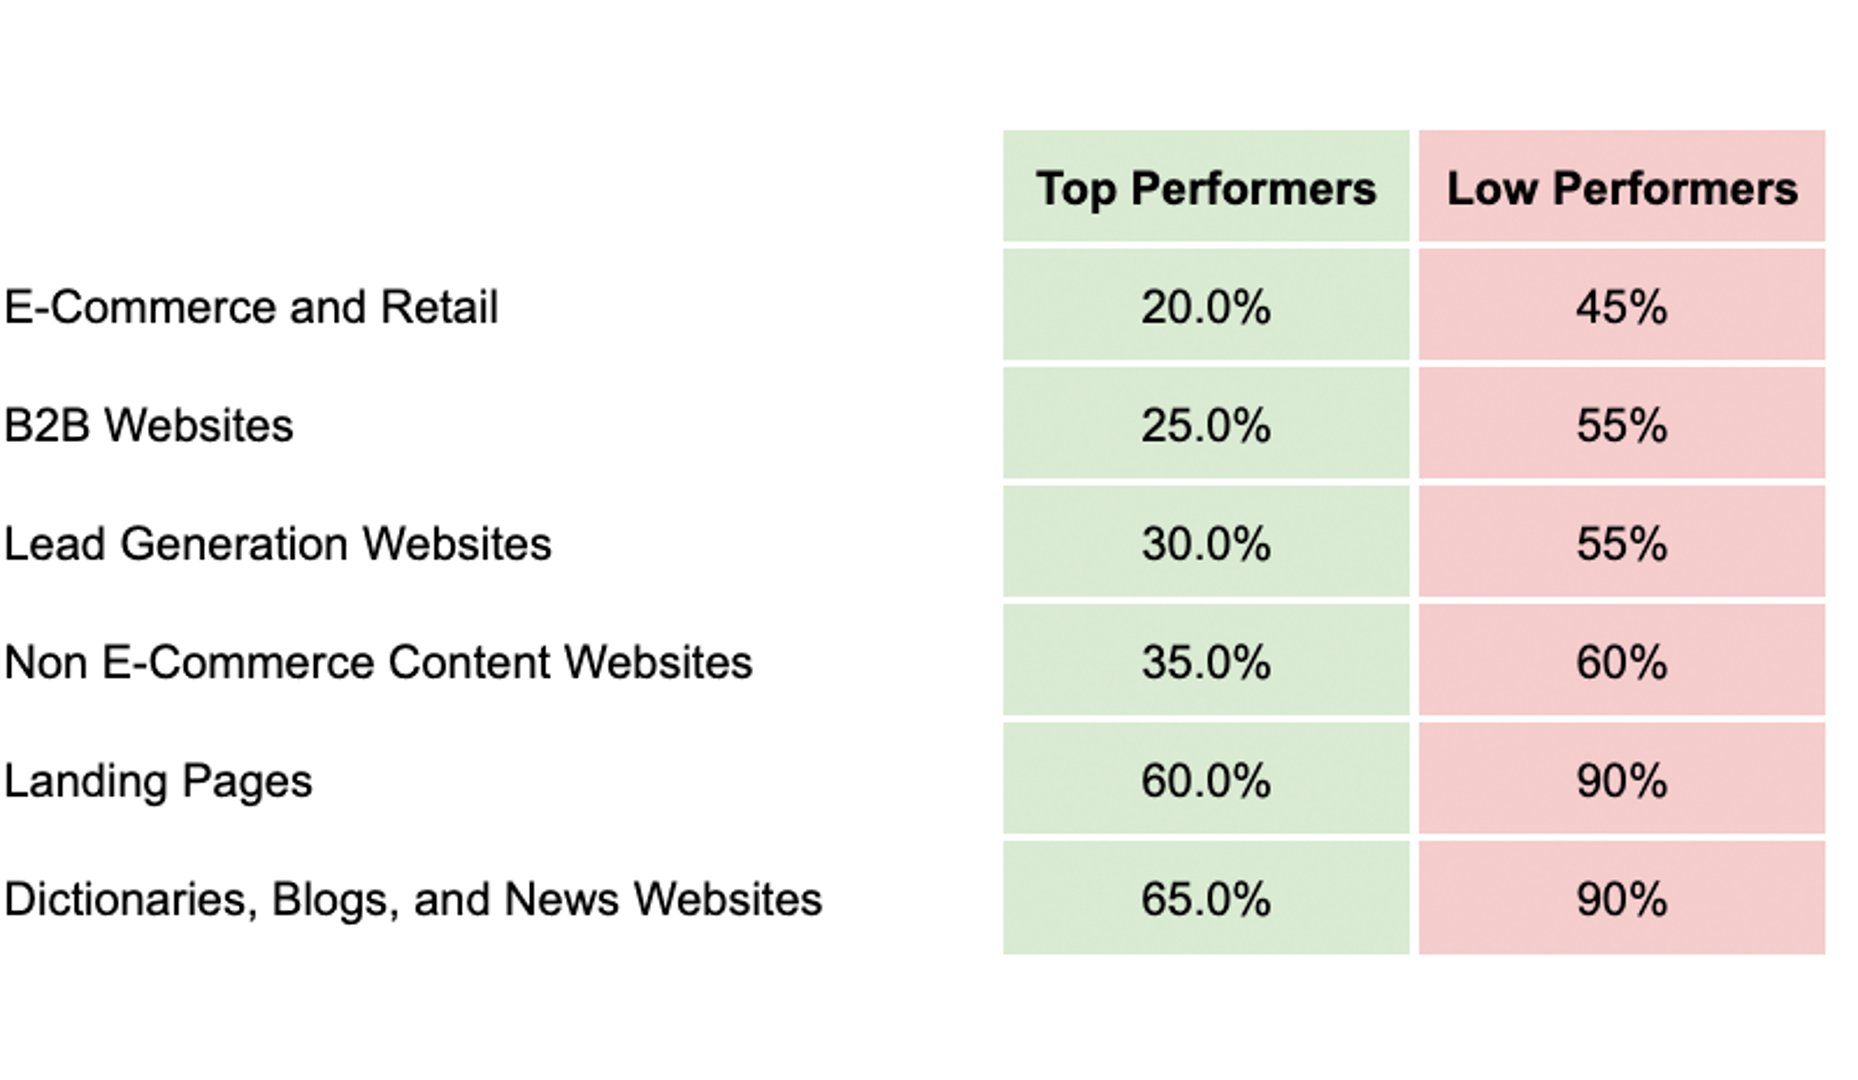
Website Bounce Rate by Category

How to visualize Website Bounce Rate?
To visualize your website bounce rate data, it is best to use either a line chart to view fluctuations over time, or a summary chart to view the current value and compare it with a previous time period. For bounce rate, weekly comparisons are helpful if you've recently made website optimization changes that you expect will improve the user experience.
Website Bounce Rate visualization examples
Website Bounce Rate

Line Chart
Here's an example of how to visualize your Website Bounce Rate data in a line chart over time.
Summary Chart
Here's an example of how to visualize your current Website Bounce Rate data in comparison to a previous time period or date range.
Website Bounce Rate
Chart
Measuring Website Bounce RateMore about Website Bounce Rate
Bounce Rate measures the percentage of users that exited the session after viewing a single page only, known as a single-page session. Any action that takes the user away from the website qualifies as a bounce, including closing browser tabs or windows, clicking an outbound link, session timeouts, and clicking the browser back button.
Although the objective of many websites is to engage the user across multiple pages, there are some scenarios where it is appropriate for users to engage with a single web page, for example, a campaign specific landing page. It is therefore important to measure bounce rate alongside other metrics such as the average time spent on a page and the goal conversion rate.
Website Bounce Rate can be measured by device as well. A website is likely to have a higher bounce rate when viewed from a mobile device as opposed to a desktop. Since there are so many factors at play, it is crucial to analyze the whole context of the website and its function before deciding if the bounce rate is too high or low.
Recommended resources related to Website Bounce Rate
Check out the 2021 Landing Page Conversion Benchmarks report from our friends at Unbounce.Contributor

