A page has 1,500 page views, 1,000 page exits, and 300 minutes of total time spent. Average Time on Page = 300 / (1,500 – 1,000) = 300 / 500 = 0.6 minutes, or 36 seconds. This means the average engaged visitor spent 36 seconds on the page before navigating elsewhere.
Average Time on Page
Last updated: Jun 04, 2026
What is Average Time on Page?
Average Time on Page is a web analytics metric that measures the average time all users spend on a single page, excluding exit pages and bounces. Exit pages are the last pages in a session; bounces are single-page sessions. Because the metric excludes these, it reflects only engaged, multi-page visits.
Average Time on Page Formula
ƒ Sum(Time Spent on Page) / ( Count(Page Views
Description: Page views are the total count of times a page loads or reloads in a user's browser, including repeat visits by the same user.
) - Count(Page Exits) )How to calculate Average Time on Page
Start tracking your Average Time on Page data
Build and track this metric in PowerMetrics, a modern analytics platform that lets you define metrics and connect your own data.
Get PowerMetrics Free
What is a good Average Time on Page benchmark?
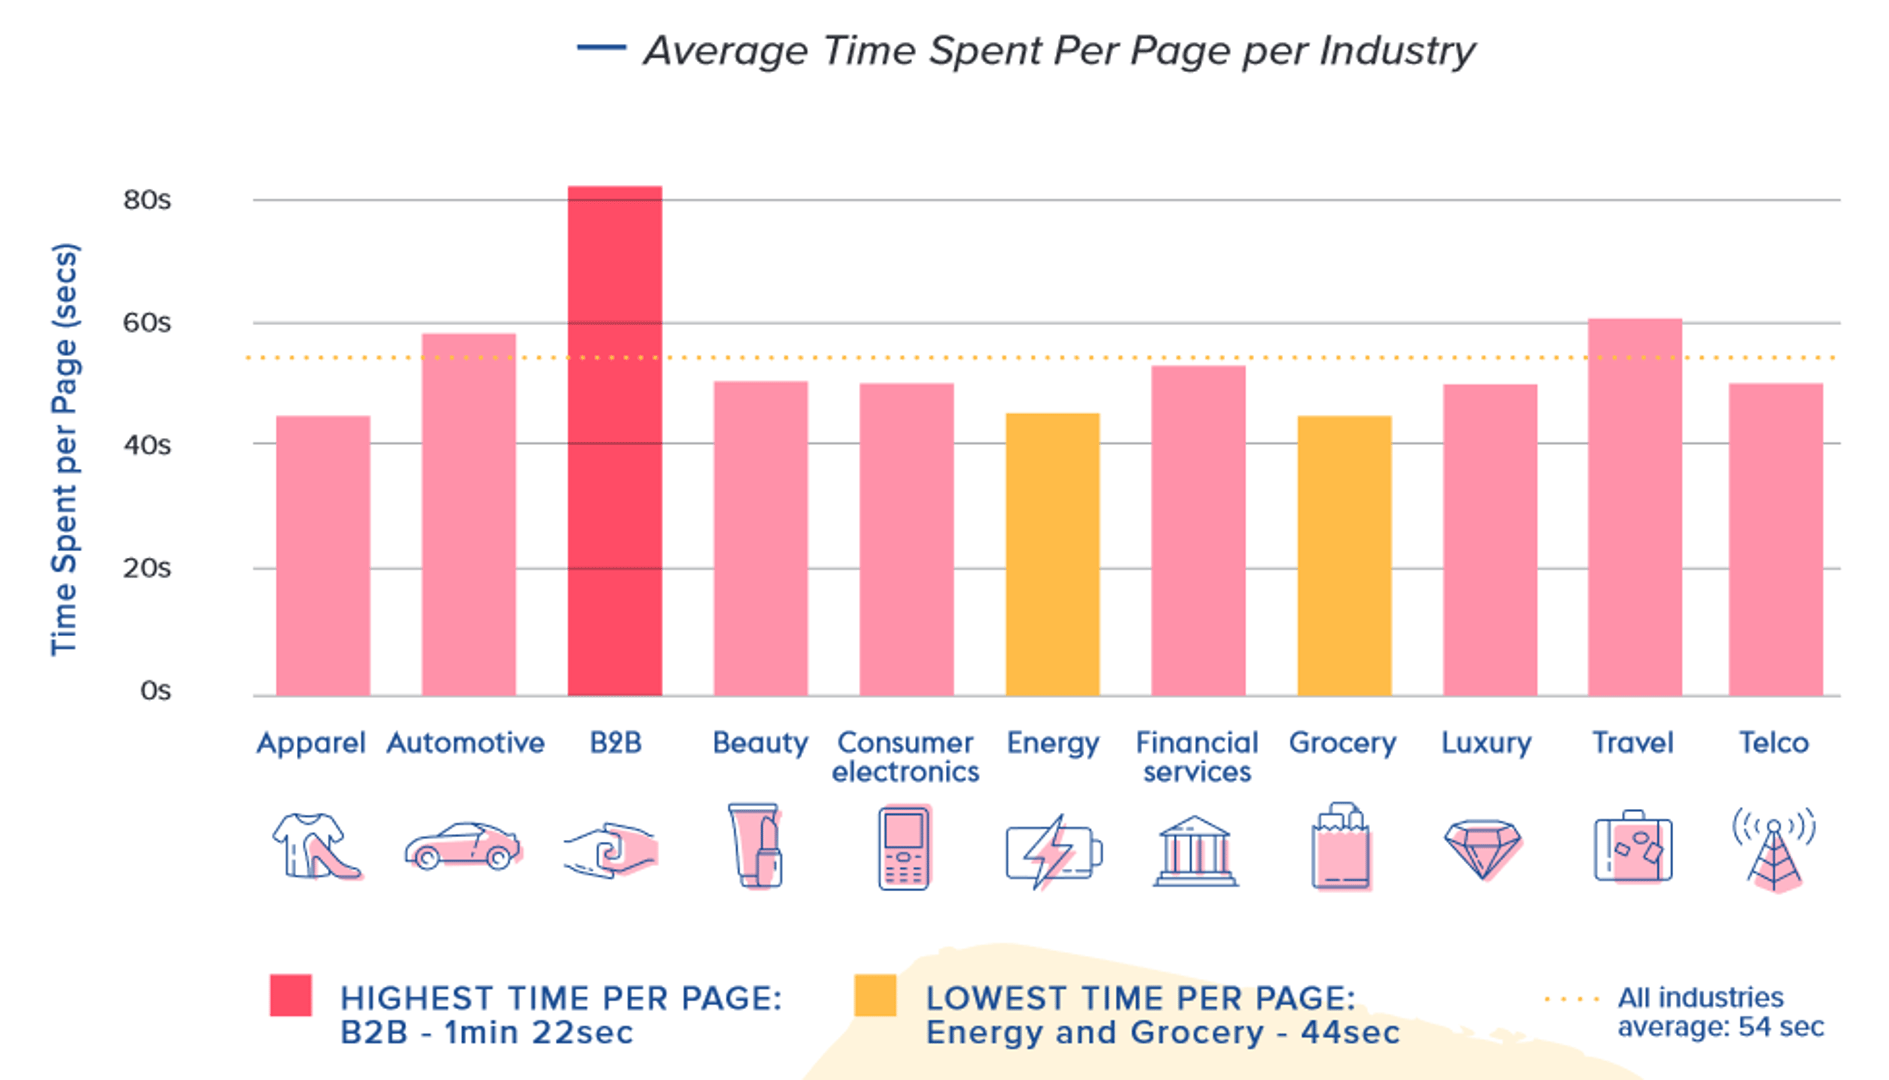
A cross-industry benchmark for Average Time on Page is approximately 52 seconds. B2B websites tend to average closer to 82 seconds, based on analysis of billions of user sessions. These figures vary by industry, device type, content type, and traffic source. Internal benchmarking is more reliable than industry averages: track your own Average Time on Page over time and compare against your historical data by page type and audience segment.
Average Time on Page benchmarks
Average Time on Page by Industry

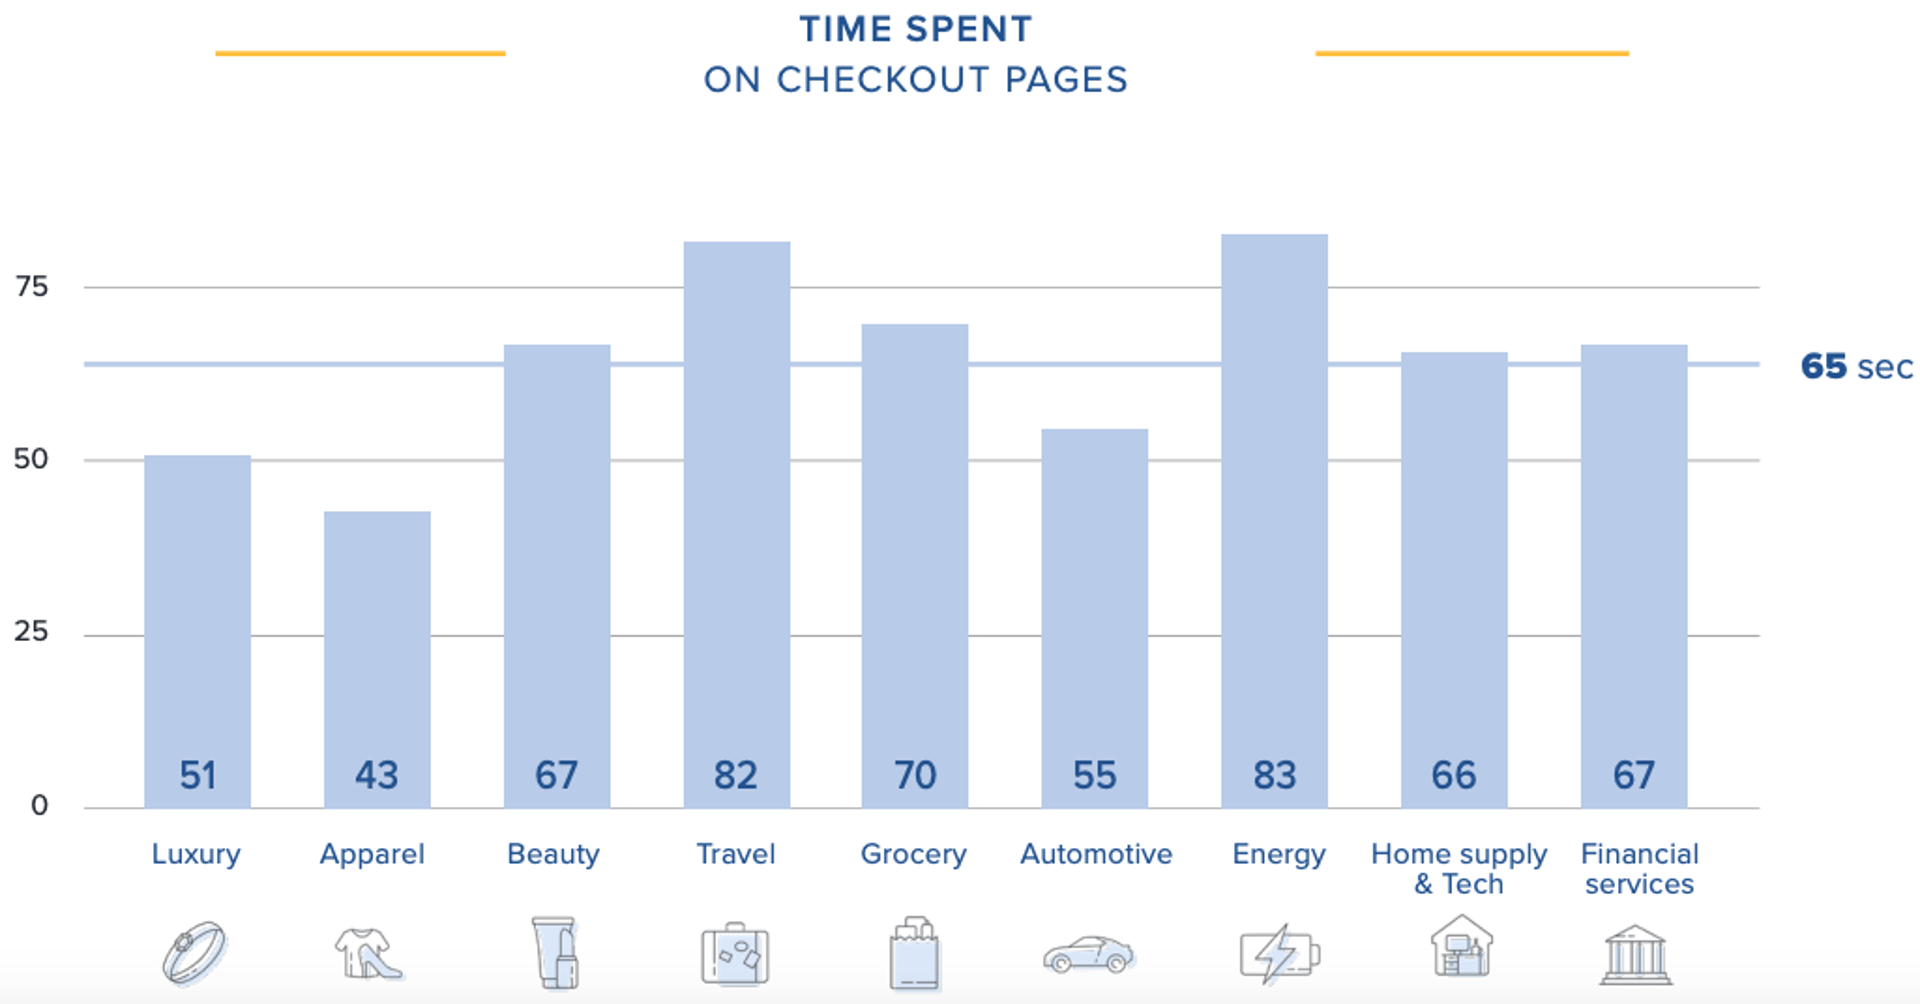
Average Time on Checkout Page by Industry

How to visualize Average Time on Page?
Average Time on Page is usually expressed in seconds. It is rare to see this number exceed a couple minutes, especially when looking at your website as a whole. Individual pages might show a higher time on page, but you generally want to use your overall time on page as a benchmark for specific pages on your website. When tracking Average Time on Page, make sure you study how this metric changes over time in response to your content, marketing strategy, and site performance / SEO efforts. Take a look at the examples:
Average Time on Page visualization examples
Average Time on Page

Line Chart
Here's an example of how to visualize your Average Time on Page data in a line chart over time.
Summary Chart
Here's an example of how to visualize your current Average Time on Page data in comparison to a previous time period or date range.
Average Time on Page
Chart
Measuring Average Time on PageMore about Average Time on Page
Average Time on Page tells you how long visitors spend reading or interacting with a specific page before moving on. It excludes exit pages (the last page in a session) and bounces, so the metric reflects only engaged, multi-page visits.
How Average Time on Page is calculated
Most analytics platforms, including Google Analytics 4, calculate Average Time on Page by recording a timestamp when a user loads a page and another when they navigate to the next page. The difference between those timestamps is the time spent on that page.
Because the platform needs a second page load to record the exit timestamp, exit pages have no measurable time. Sessions that end on a single page (bounces) are also excluded. This means the metric can read higher than actual engagement, particularly for pages designed to end a session, such as order confirmation or thank-you pages.
Keep this in mind when analyzing pages with naturally high exit rates. For those pages, Average Time on Page is not a reliable signal of engagement.
Why Average Time on Page matters
Average Time on Page is a proxy for content engagement. When a user spends meaningful time on a page, it suggests the content is relevant and holding their attention. When time is low relative to the content's length or complexity, it may signal a mismatch between audience expectations and what the page delivers.
This metric is most useful when tracked alongside related metrics such as bounce rate, sessions, scroll depth, and content engagement. No single metric tells the full story. Average Time on Page adds a time dimension that click-based metrics miss.
Common decisions informed by Average Time on Page include:
Content quality assessment: Is the page holding attention long enough for the reader to absorb the message?
A/B testing: Does a revised headline, format, or layout increase time on page?
Funnel analysis: Are users spending enough time on key landing pages before converting?
Content pruning: Pages with consistently low time may be candidates for consolidation or removal.
What influences Average Time on Page
Several factors affect whether a high or low value is meaningful:
Content type: A long-form guide should have a higher Average Time on Page than a product category page. Compare pages of similar type and purpose.
Device type: Mobile users tend to spend less time per page than desktop users.
Traffic source: Organic search visitors often spend more time than social media visitors, who may arrive with lower intent.
Page purpose: A contact page or pricing page may have a low Average Time on Page by design. That is not a problem.
Background tabs: Time is recorded even when a tab is open but not in focus. This can inflate values on pages users open and leave idle.
Best practices for tracking Average Time on Page
Before drawing conclusions from this metric, apply a few practical checks:
Filter by page type. Group pages by category (blog posts, product pages, landing pages) and set expectations for each group separately.
Exclude high-exit pages. Pages with exit rates above 70–80% will produce unreliable Average Time on Page values. Flag these and interpret with caution.
Segment by device and traffic source. Aggregate numbers hide meaningful differences. A page may perform well on desktop but poorly on mobile.
Pair with scroll depth. If scroll depth data is available, use it alongside Average Time on Page to confirm whether users are actually reading or just leaving a tab open.
Track trends, not snapshots. A single data point is rarely meaningful. Look for directional change over weeks or months.
Common challenges
Inflated values from idle tabs. Analytics platforms cannot distinguish between active reading and an idle open tab. High Average Time on Page values on certain pages may reflect this rather than genuine engagement.
Exit page exclusion creates blind spots. If a key conversion page (such as a checkout confirmation) also functions as an exit page, Average Time on Page will not capture user behaviour there at all.
Bounces are excluded by default. If a significant share of your traffic bounces, the metric represents only a subset of visitors. This can make engagement look stronger than it is across the full audience.
Averages mask distribution. A page where half of users spend 10 seconds and half spend three minutes will show an average that describes neither group accurately. Where possible, use median time or cohort analysis to get a clearer picture.
Average Time on Page Frequently Asked Questions
What is the difference between Average Time on Page and Average Session Duration?
Average Time on Page measures the average time spent on a specific page or group of pages.
Average Session Duration measures the average time users spend across an entire session, which may include multiple pages. Both metrics provide insight into engagement, but Session Duration gives a broader view of overall site experience.
Read more about the differences between Average Time on Page vs Average Session Duration.
How do I see Average Time on Page in Google Analytics?
To check your Average Time on Page in Google Analytics, navigate to the Behaviour overview under reports. Here, you can see your website's overall Average Time on Page and explore further.
How to improve Average Time on Page?
Here are the top 3 tips to improve Average Time on Page:
- Develop high quality content that is relevant to your niche and provides value to your customer.
- Format your content to be easily skimmed and readable, adding summaries to the top of articles and a table of contents to preview your content.
- Include a compelling CTA that closely captures your user's intention on your page.
Contributor

