The posts on your Facebook business page receive a total of 10,000 likes, 500 shares, 500 comments, and more. This means that your Content Engagement totals 11,000.
Content Engagement
Last updated: Jun 04, 2026
What is Content Engagement?
For content and social media marketers, Content Engagement may be one of the most important ways to know what is working and how to improve your craft. Content Engagement measures all engagements resulting from content generated in a social media account including shares, reactions (e.g., likes), comments, and re-tweets. These metrics are considered the most important when looking at the effectiveness of your marketing campaigns and overall strategy
Content Engagement Formula
ƒ Count(Likes
Description: Media Likes is the total count of likes you receive on multiple formats of media posted on your social media page. Media includes photo posts, video posts, reels, and more.
) + Count(CommentsDescription: A Post Comment, or simply Comment, is a primarily text-based form of engagement on a social media platform which allows users to respond to posts in their own words. The number of comments on a piece of content indicates the level of engagement users have with that content.
) + Count(SharesDescription: Post Shares is the total number of times a post was shared across social media platforms such as Facebook, X, Instagram, LinkedIn, or Pinterest. A share extends a post's visibility beyond its original audience. It is an active engagement metric used to gauge how strongly content resonates with an audience.
) + Count(ClicksDescription: Post Clicks is the total number of times a post was clicked. This includes, for example, photo views, video plays, and expanding to read a post, but does not include comments, likes, and shares.
)How to calculate Content Engagement
Start tracking your Content Engagement data
Use PowerMetrics, modern analytics platform, to monitor your data. Choose a service below to start tracking your Content Engagement instantly.

What is a good Content Engagement benchmark?
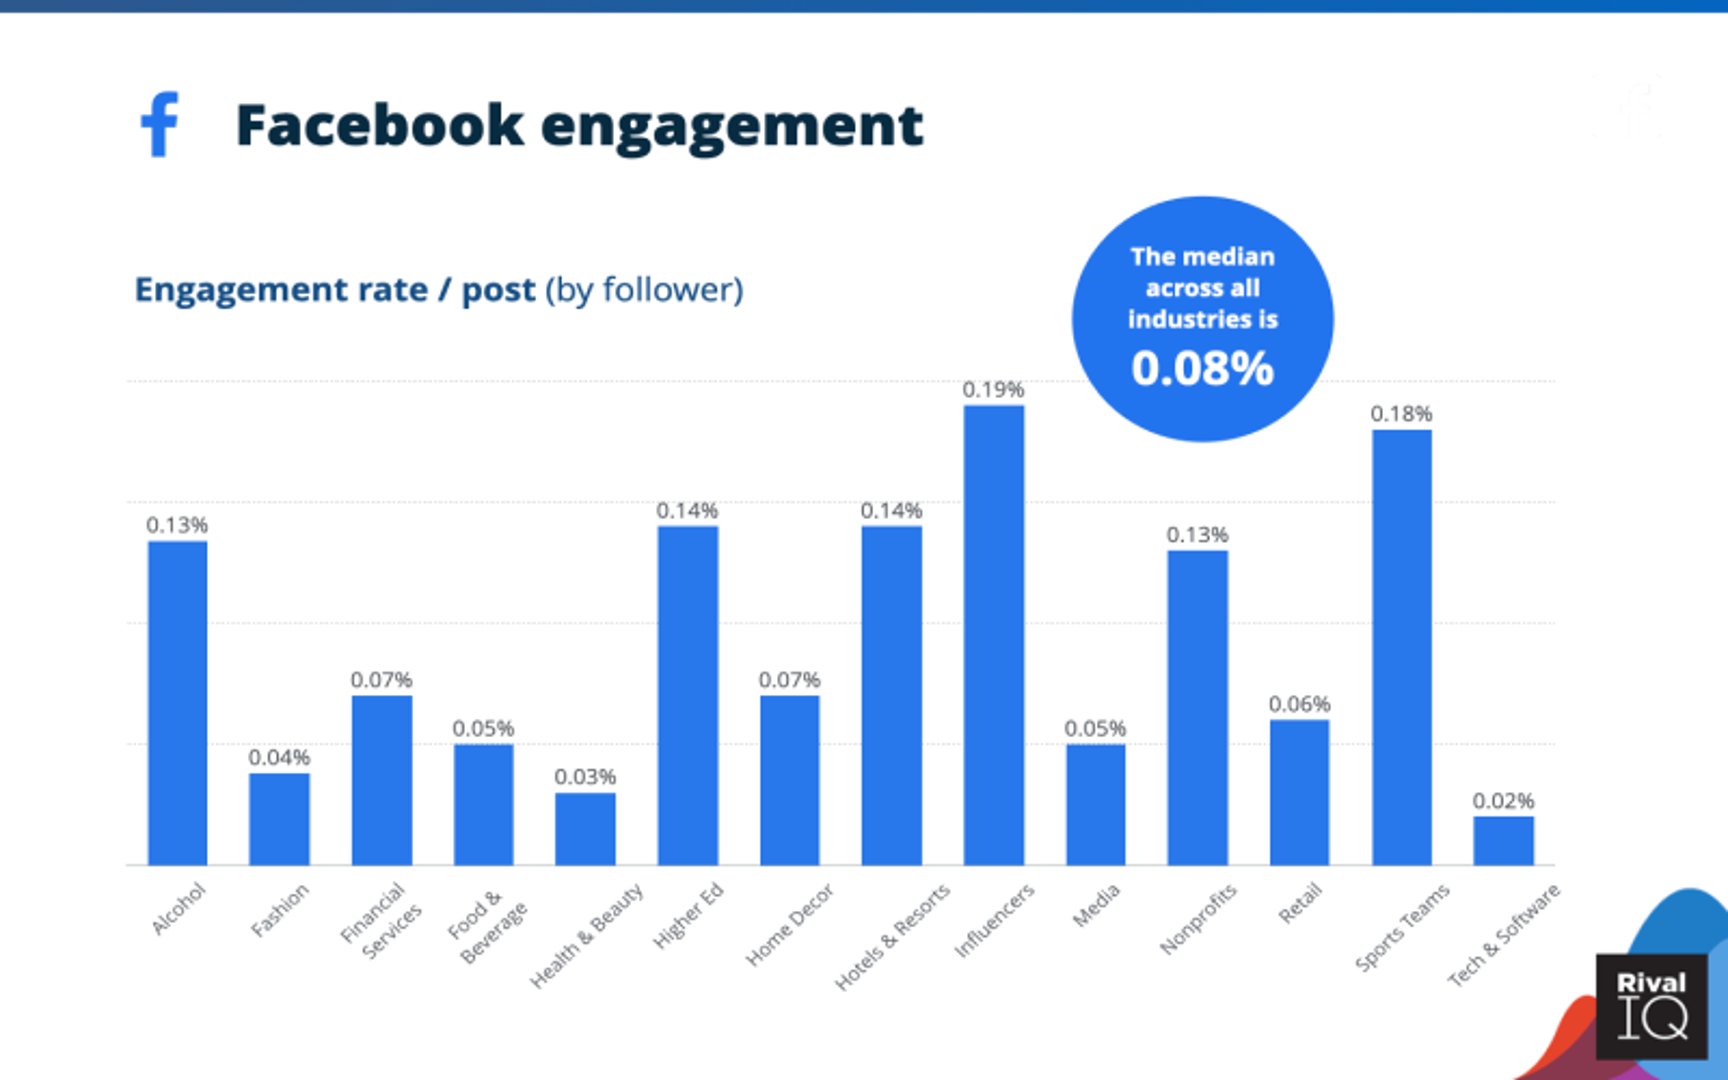
The engagement rate is 0.08% across industries on Facebook, according to RivalIQ's 2021 benchmark study.
Content Engagement benchmarks
Facebook Engagement Rate by Industry

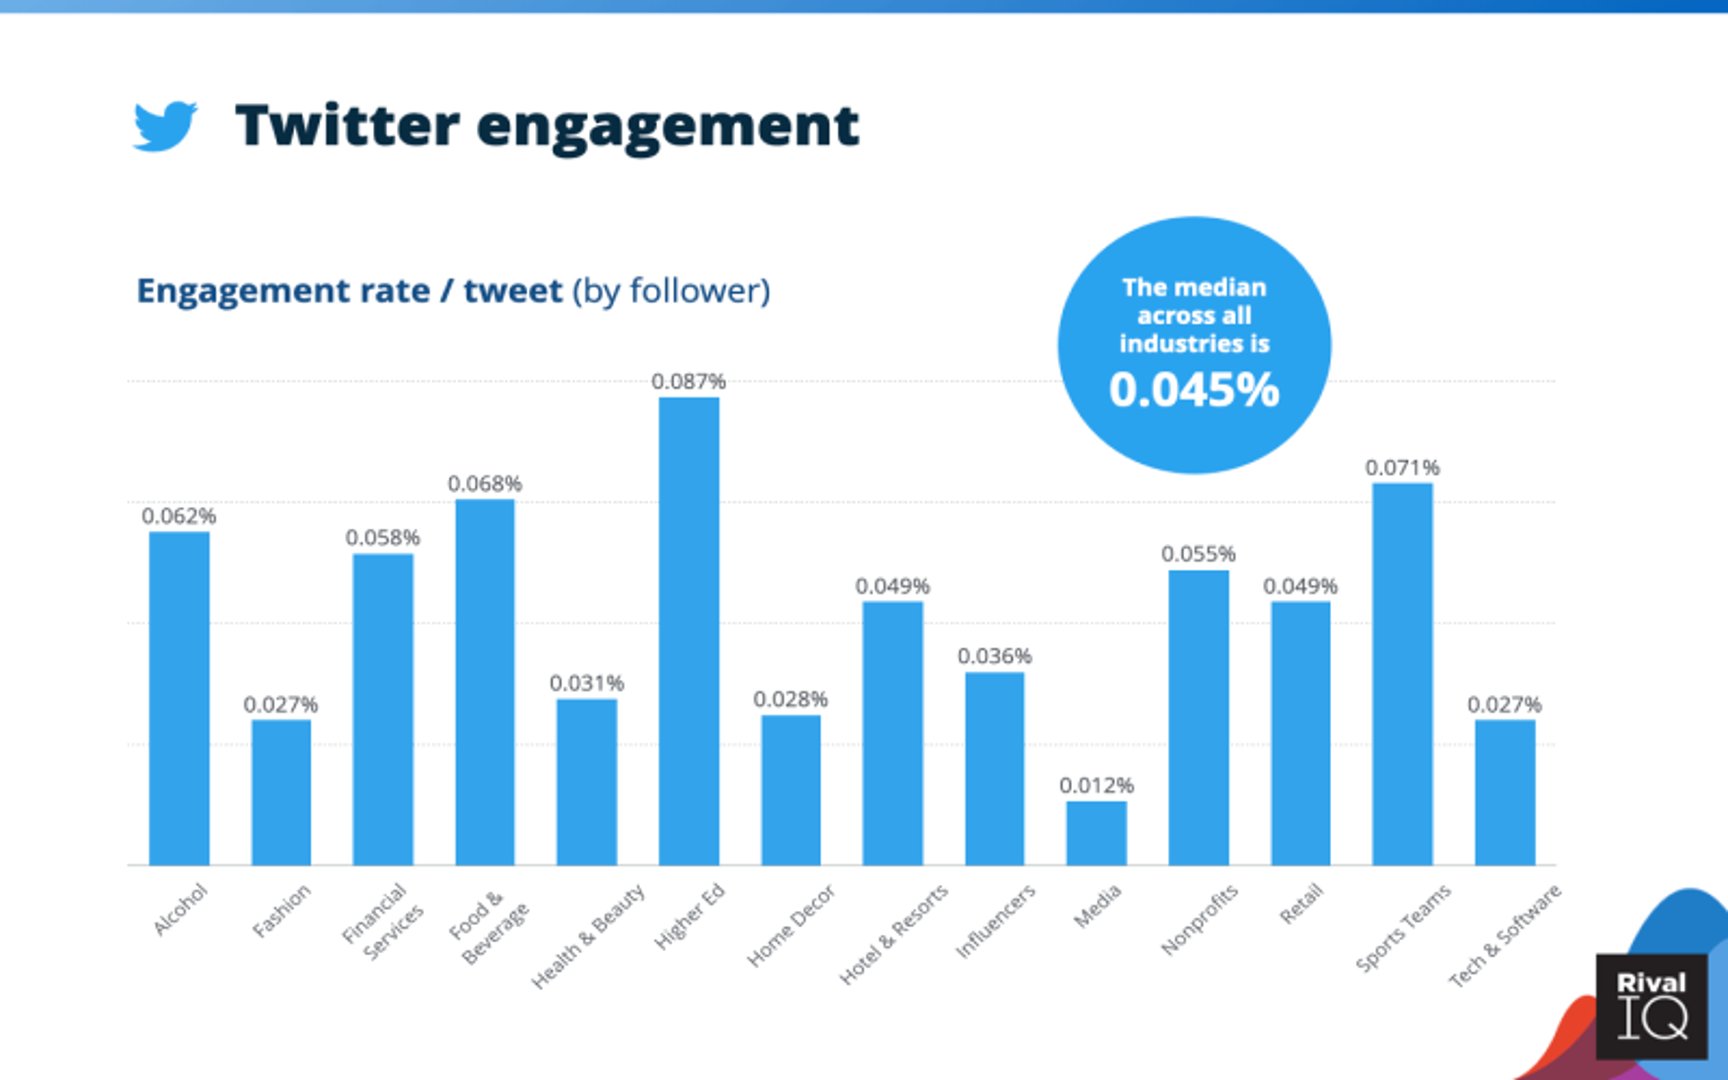
Twitter Engagement Rate by Industry

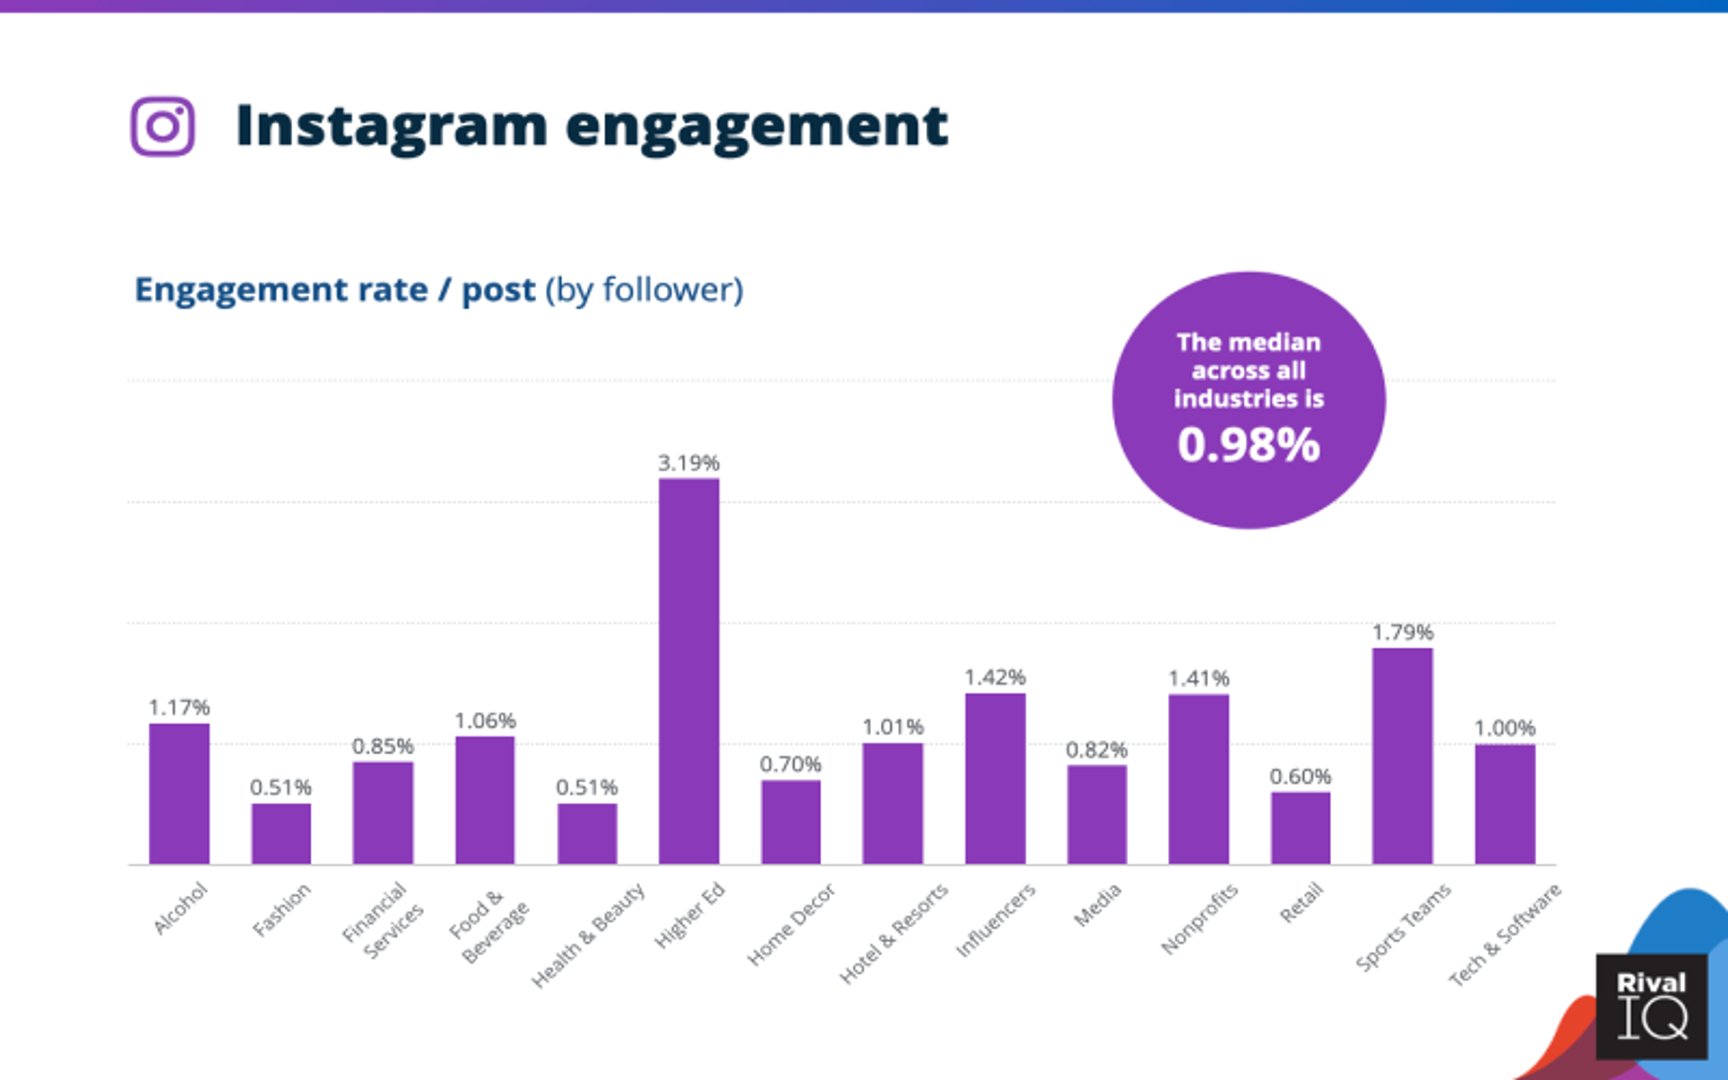
Instagram Engagement Rate by Industry

How to visualize Content Engagement?
Visualize your Content Engagement data with a summary chart that compares your current value to a previous time period.
Content Engagement visualization example

Summary Chart
Here's an example of how to visualize your current Content Engagement data in comparison to a previous time period or date range.
Content Engagement
Chart
Measuring Content EngagementMore about Content Engagement
Content Engagement can help you understand the effectiveness of your campaigns by measuring your audience's level of engagement with your content. Users tend to engage more with content the more you connect with them, so the key to increased Content Engagement is relevant and high quality content.
While high levels of engagement is a good sign, remember to tie it in with your marketing objectives. Monitor your Click-Through Rate along with Content Engagement and Engagement Rate to understand how well your efforts on social media are converting to purchases, sign-ups, downloads, website visits, and other actions crucial to your business.
You can review and compare your performance over time, using line graphs to show the number of likes, comments, shares, and clicks your page is generating each month. This can help you determine which posts are the most engaging and what content is most interesting to your audience. When a user engages with your posts, their network will see your content and help increase your brand’s awareness. As with most metrics, the results you get from measuring Content Engagement will be a combination of both how good your content is, and how much of a fit it is for the audience you are attracting.
Engagement on social media platforms, which is generally higher in the funnel, measures a much larger audience. The most common Content Engagement triggers are Likes, re-tweets, shares, and clicks. Social media platforms are optimized for quick and easy engagement, but it's important to weigh a share or comment higher than a like because it generally requires more effort and thought.
Content Engagement Frequently Asked Questions
How do I increase my content engagement?
One of the best ways to increase engagement is by creating meaningful content that offers value to your audience. For example, focus on how your product will make the user feel, rather than just broadcasting product features. This will allow users to associate positive emotion with your product, therefore increasing engagement.
What's the best data visualization for Content Engagement?
This depends on what you want to learn from your content metrics. If you want to measure engagement over time, use a line graph to show your progress. If you want to measure specific campaign performance, use bar graphs or pivot tables.
I have a lot of Facebook data. How can I track content engagement easily?
Free analytics tools, such as PowerMetrics, often fetch the right data for you. This eliminates the need for guesswork or calculations. In fact, PowerMetrics connects to your Facebook account and instantly creates a content engagement data visualization for you with just a few clicks.
Recommended resources related to Content Engagement
A well written article by Nels Gilbertson-Urtel on Content EngagementContributor