A website receives 10,000 sessions in a month. The combined session time across all users totals 400 hours (24,000 minutes).
The Average Session Duration is: 24,000 minutes / 10,000 sessions = 2.4 minutes.
Last updated: Jun 04, 2026
Average Session Duration measures the average amount of time users spend per session on your website. It is calculated by dividing the total time spent across all sessions by the total number of sessions. This metric helps you understand overall engagement and whether users are consuming your content in a meaningful way.
A website receives 10,000 sessions in a month. The combined session time across all users totals 400 hours (24,000 minutes).
The Average Session Duration is: 24,000 minutes / 10,000 sessions = 2.4 minutes.
Use PowerMetrics, modern analytics platform, to monitor your data. Choose a service below to start tracking your Average Session Duration instantly.

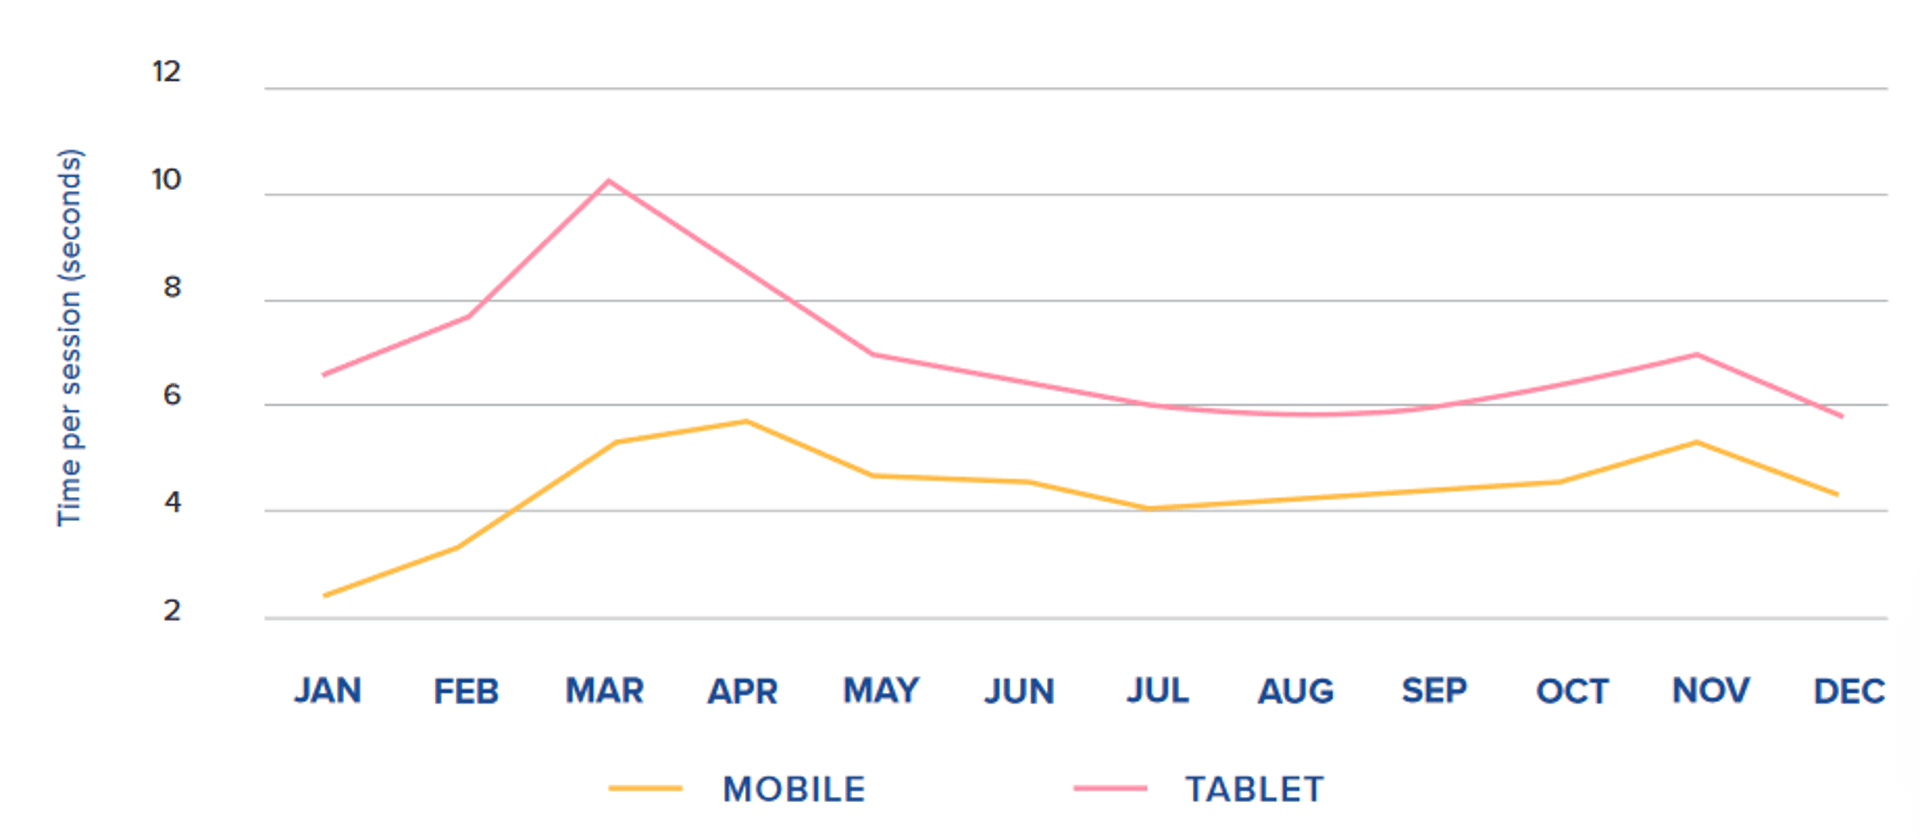
A typical Average Session Duration ranges from 2–4 minutes, according to Google Analytics benchmarking. Device-specific insights can vary: for example, Contentsquare’s 2021 report found average application screen time of 4 minutes, 24 seconds on mobile and 6 minutes, 38 seconds on tablet. Keep in mind that benchmarks are contextual; content type, user intent, and website goals strongly influence what constitutes “good” engagement.
Trend over time: Use a line chart to observe changes in Average Session Duration over days, weeks, or months. Segment by device, traffic source, or content type to identify patterns or opportunities. Performance comparison: Use a summary chart (bar or table) to compare pages, sections, or campaigns, helping identify top-performing content and areas for optimization.
Average Session Duration
Average Session Duration
A session is defined as a period of user activity on your website that begins when a user lands on the site and ends after a period of inactivity or when the user exits. Longer sessions often indicate higher engagement, increased likelihood of conversions, and stronger potential for building relationships with users.
Tracking Average Session Duration gives insight into how effectively your content or website layout captures attention. Lower values may indicate that users are not finding content engaging, experiencing navigation issues, or leaving without completing desired actions. While older benchmarks suggested an average session of 2–4 minutes, engagement can vary widely by industry, device type, and content format. Pages or sections that exceed these averages often provide exceptional value, such as high-quality information, interactive content, or multimedia that keeps users engaged.
It’s important to note that individual session duration is calculated differently from the overall Average Session Duration. Modern analytics platforms (like Google Analytics 4) rely on engagement events rather than simple page hits. For example, a session may only count as “engaged” if a user triggers an interaction, such as playing a video, scrolling a page, or clicking a link. Sessions without engagement events may be calculated differently, often defaulting to a minimal time based on non-interaction hits.
Average Time on Page measures the average time spent on a specific page or group of pages.
Average Session Duration measures the average time users spend across an entire session, which may include multiple pages. Both metrics provide insight into engagement, but Session Duration gives a broader view of overall site experience.
Read more about the differences between Average Time on Page vs Average Session Duration.