A travel blog records 45,000 page views and 30,000 sessions in one month. Dividing 45,000 by 30,000 gives a Pages per Session of 1.5. This means the average visitor views 1.5 pages per visit — a signal worth investigating for a content-rich site.
Pages Per Session
Last updated: Jun 04, 2026
What is Pages Per Session?
Pages per Session is the average number of pages a user views during a single website visit, calculated by dividing total page views by total sessions. It indicates how well a site holds visitor attention and encourages exploration beyond the initial landing page.
Alternate names: Page Views Per Session, Views Per SessionPages Per Session Formula
ƒ Count(Total Page Views
Description: Page views are the total count of times a page loads or reloads in a user's browser, including repeat visits by the same user.
) / Count(Total SessionsDescription: A session is a group of user interactions with a website that occur within a defined timeframe. Analytics platforms define a session as a period of continuous engagement that begins when a user arrives and ends after 30 minutes of inactivity or when the user leaves. Each session can contain multiple interactions, including page views, events, downloads, form submissions, and e-commerce transactions. Sessions are fundamental to understanding user behaviour patterns and website performance, capturing the complete journey a user takes during a single visit.
)How to calculate Pages Per Session
Start tracking your Pages Per Session data
Use PowerMetrics, modern analytics platform, to monitor your data. Choose a service below to start tracking your Pages Per Session instantly.


What is a good Pages Per Session benchmark?
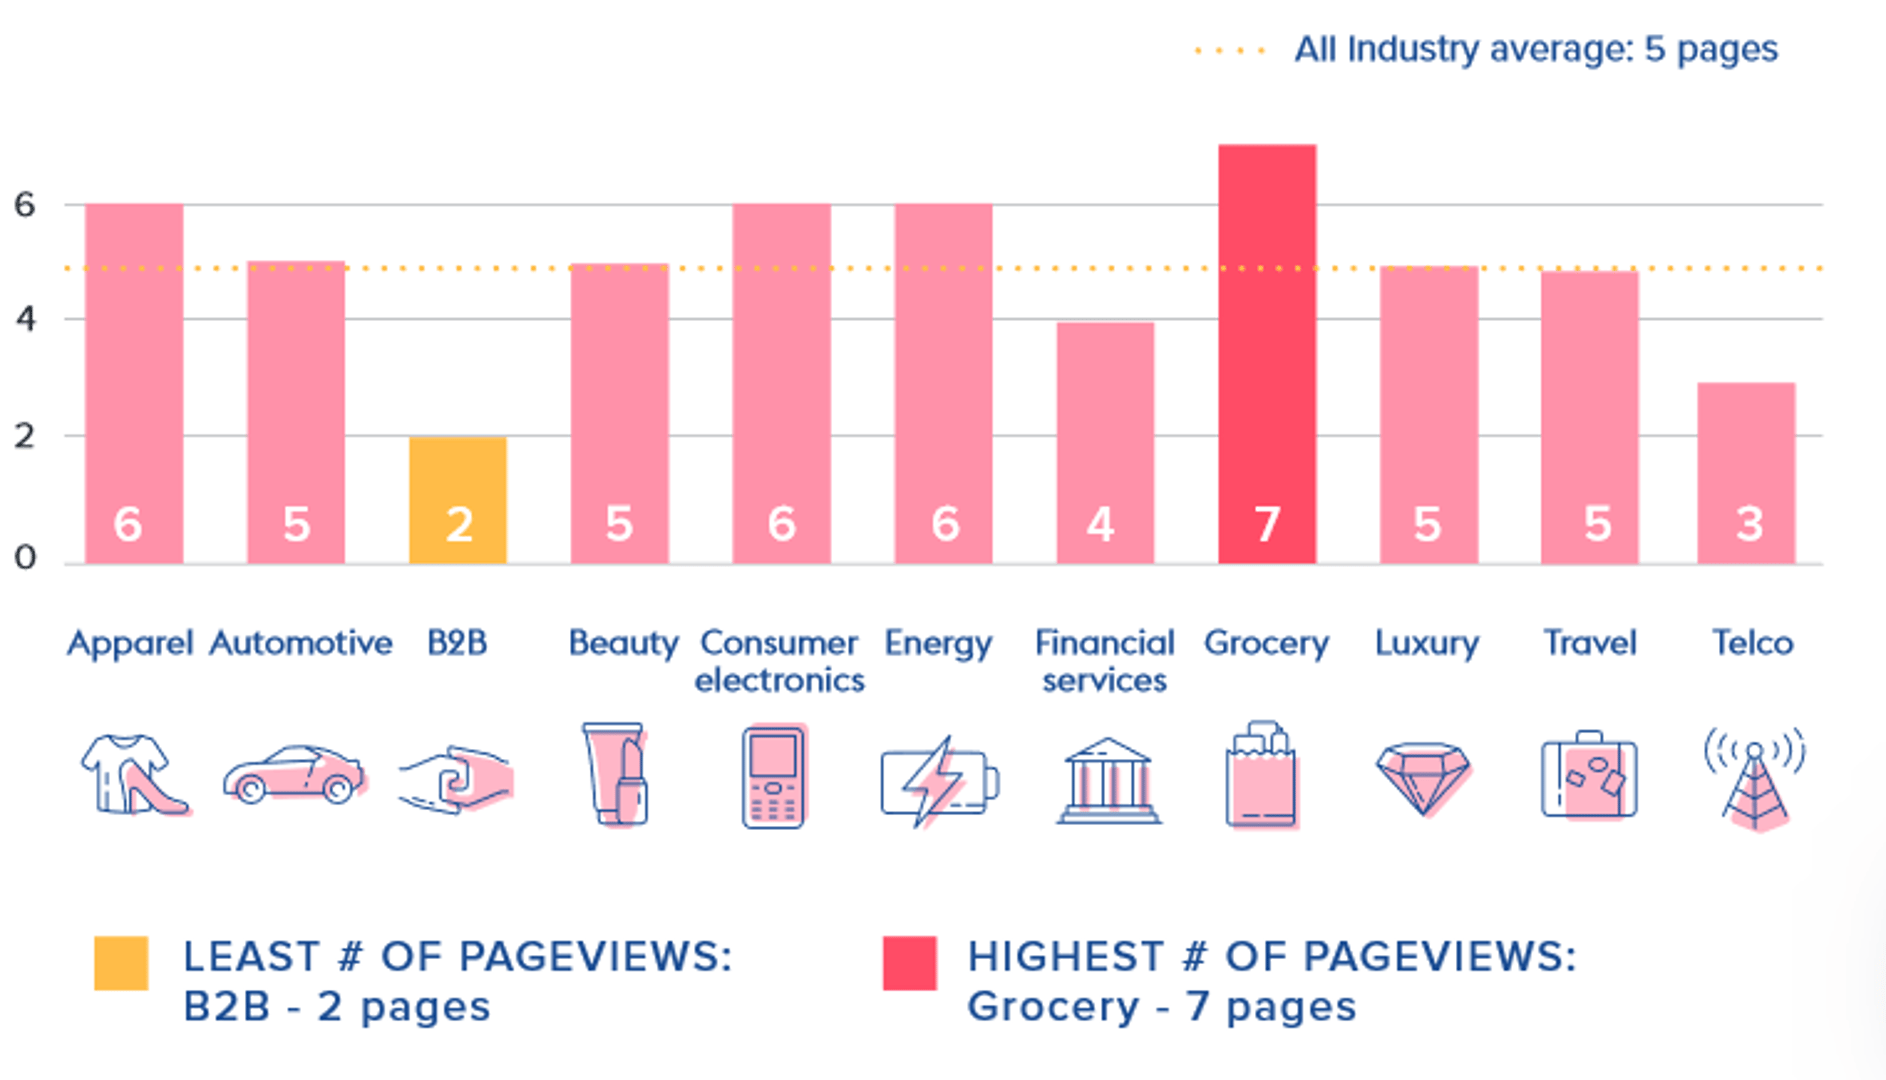
Pages per session benchmarks vary by site type. B2B and SaaS sites typically average 2–3 pages per session. Media and content sites average 3–5. E-commerce sites range from 5–10. Grocery and retail sites average around 7 pages per session. The cross-industry average is approximately 5 pages per session.
Pages Per Session benchmarks

How to visualize Pages Per Session?
The default view for Pages per Session in Google Analytics is a summary chart, also know as a 'metric view' or 'KPI view'. This view displays your Pages per Session as a single number for a given period of time. You can also compare the current value to a previous period to observe changing trends. You can also display your Pages per Session in a bar chart, if you choose to segment your data - perhaps by user segments (device type, age group, traffic source, etc.). Take a look at the examples to know how to get started visualizing your Pages per Session data:
Pages Per Session visualization examples
Pages Per Session

Bar Chart
Here's an example of how to visualize your Pages Per Session data in a bar chart to observe segmented data.
Summary Chart
Here's an example of how to visualize your current Pages Per Session data in comparison to a previous time period or date range.
Pages Per Session
Chart
Measuring Pages Per SessionMore about Pages Per Session
How to interpret pages per session
A high pages per session figure generally signals that visitors find your content engaging and are browsing beyond the page they landed on. Combined with a long Average Time on Page and a healthy conversion rate, it's a strong indicator of site health.
But context matters. Consider what your site is designed to do:
- E-commerce and media sites benefit from high page depth. More pages typically mean more product views, more ad impressions, and more purchase opportunities.
- B2B and SaaS sites often have lower numbers by design. A visitor who reads one detailed landing page and books a demo is more valuable than one who browses ten pages without converting.
- Single-purpose sites — a landing page, a booking form, a documentation hub — may legitimately score low because users accomplish their goal quickly.
High pages per session can also flag problems. If users are clicking through many pages but not converting, they may be lost rather than engaged. Always cross-reference with bounce rate, session duration, and conversion data before drawing conclusions.
Pages per session in Google Analytics 4
In Google Analytics 4 (GA4), this metric appears as Views per Session rather than Pages per Session. The underlying calculation is the same: total page views divided by total sessions.
GA4 encourages analysts to evaluate Views per Session alongside:
- Average Engagement Time — how long users actively interact with your site
- Engagement Rate — the share of sessions that meet a minimum engagement threshold
- Conversion Rate — whether browsing behaviour translates into meaningful actions
Relying on pages per session alone can be misleading. A fuller picture requires pairing it with metrics that reflect intent and outcome, not just volume.
What influences pages per session?
Several factors push this metric up or down. The most common include:
- Internal linking — well-placed links to related content encourage users to keep reading
- Site navigation — clear menus and logical information architecture reduce friction
- Content relevance — pages that answer questions and anticipate follow-up needs earn deeper exploration
- Page load speed — slow pages increase abandonment before a second page view occurs
- Traffic source — paid and social traffic often shows lower page depth than organic search, which tends to attract users with higher intent
How to improve pages per session
If your pages per session is below your target, focus on the factors you can directly control.
Strengthen internal linking. Add contextual links within your content to related articles, product pages, or resources. Each link is an invitation to go deeper.
Improve your navigation structure. Users should be able to find related content within one or two clicks. Review your site architecture and simplify where possible.
Add content recommendations. "Related articles" or "You might also like" modules at the end of a page reduce dead ends and keep users moving through your site.
Match content to user intent. If visitors land on a page and leave immediately, the content may not match what they expected. Review your top exit pages and adjust accordingly.
Audit page load performance. Use tools like Google PageSpeed Insights to identify slow-loading pages. Speed improvements often produce measurable gains in engagement metrics.
Pages Per Session Frequently Asked Questions
What causes Pages per Session to drop in Google Analytics?
If your Pages per Session suddenly drops in Google Analytics, check this value against other metrics such as Average Time on Page and Sign Up Conversion Rate - if those metrics have decreased too, you may need to revise your website's flow from discovery to exploration to conversion. If your time on page and conversions have gone up and your pages per session has decreased, this may be a good thing as it could indicate your website visitors are finding what they are looking for more efficiently.
How do I track Pages per Session in Google Analytics?
Navigate to the Audience Overview under the Report section of Google Analytics. Here, you can view the Pages per Session for your website and segment by user segments. For an easy, no-code and no data export option, use Klipfolio PowerMetrics for free to analyze your Pages per Session data with instant data connectors.
Contributor

