The LTV/CAC ratio measures the lifetime revenue a customer generates relative to the cost of acquiring that customer. A ratio of 3 or higher is the standard benchmark for sustainable SaaS growth.
Suppose a SaaS company has the following metrics:
- ARPA: $500/month
- Gross margin: 75%
- Monthly churn rate: 2.5%
- CAC: $6,000
Step 1 — Calculate LTV:
LTV = ($500 × 0.75) / 0.025 = $375 / 0.025 = $15,000
Step 2 — Calculate LTV/CAC:
LTV/CAC = $15,000 / $6,000 = 2.5
A ratio of 2.5 means the company earns $2.50 in lifetime value for every $1 spent acquiring a customer. That's below the 3.0 threshold, which signals the business should focus on reducing churn, improving margins, or lowering acquisition costs before scaling spend.
A healthy LTV/CAC ratio for SaaS businesses is generally considered to be 3.0 or above, indicating that a customer generates at least $3 in lifetime value for every $1 spent on acquisition.
According to a 2023 Benchmarkit study, the target benchmark range for LTV:CAC sits between 3.6 and 4.2.
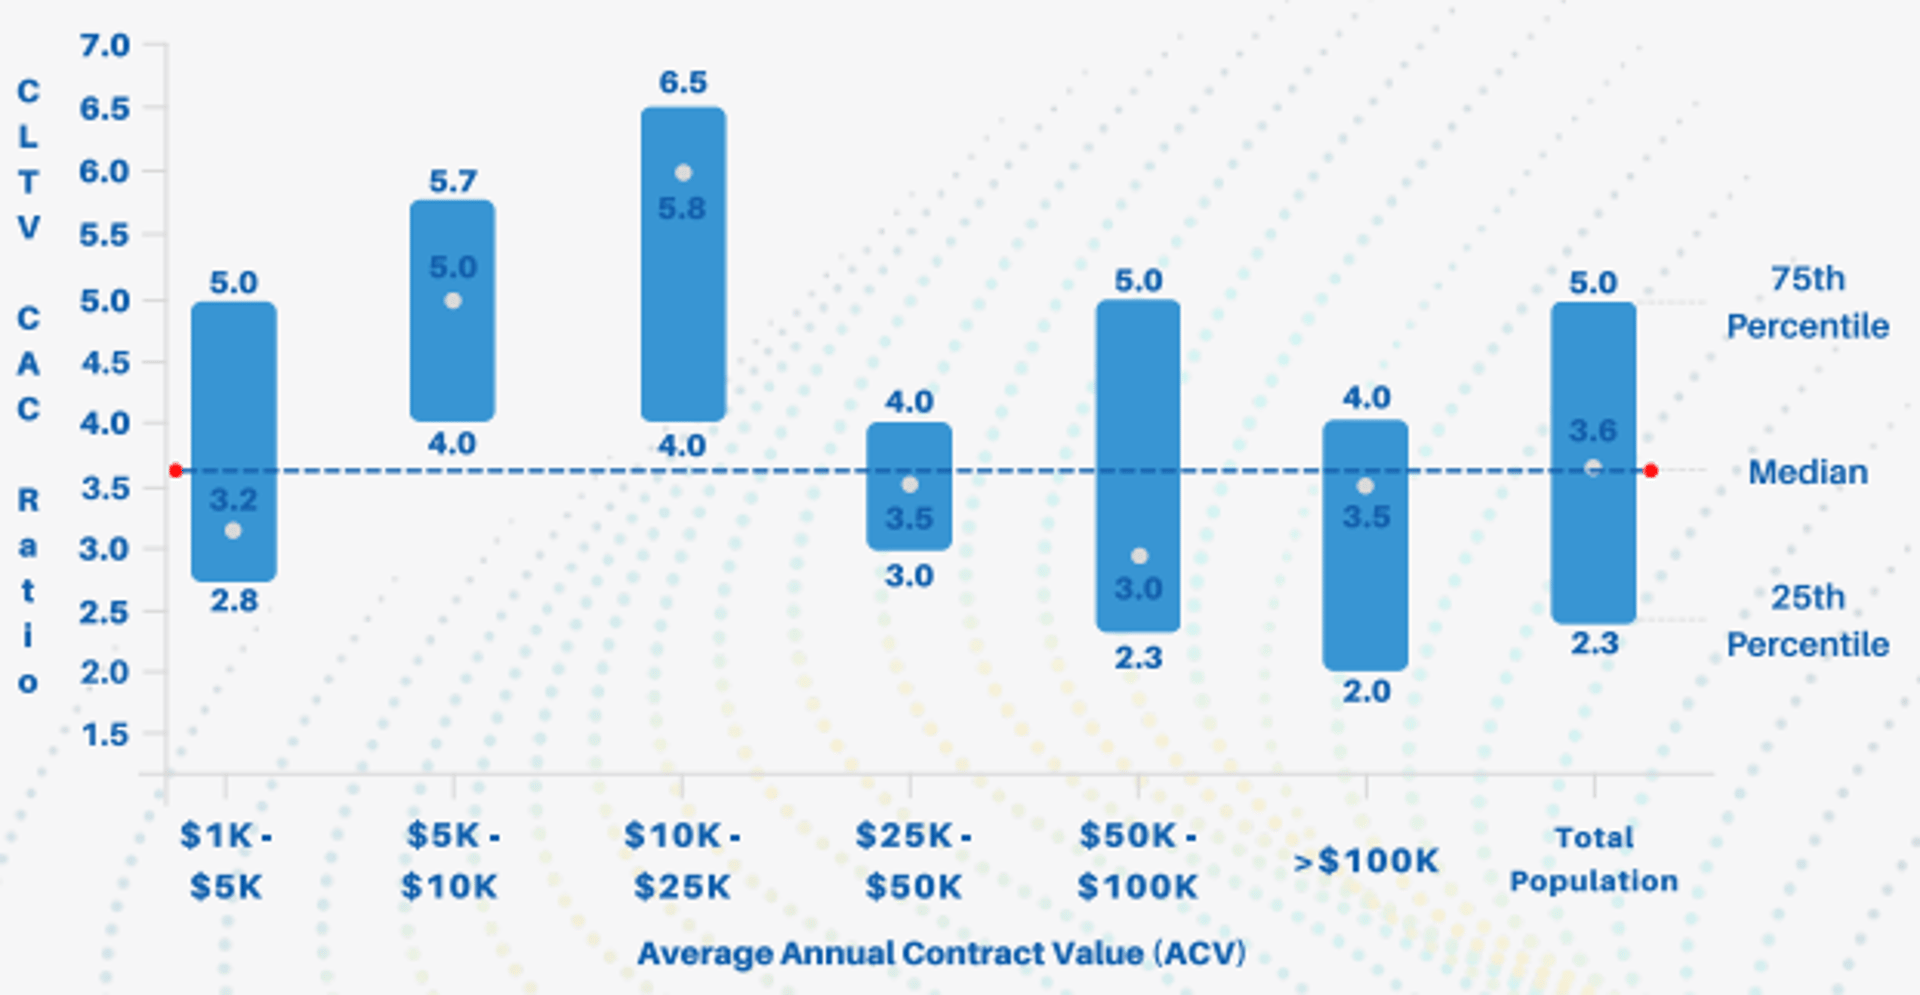
Capchase (2022, n=439) reported the following median ranges by ARR band:
- Companies at $1–5M ARR: median LTV/CAC of 3.4–4.2
- Companies at $5–15M ARR: median LTV/CAC of 4.6–6.2
Note: The Capchase data is from 2022. Verify whether updated benchmarks are available before citing in time-sensitive contexts.
Ratios are usually expressed as single-digit numbers so it would be optimal to visualize Lifetime Value to Cost of Acquisition Ratio with a summary chart. Summary charts compare current values to a previous time period.
How to interpret your LTV/CAC ratio
The ratio tells you whether your growth model is efficient — and how hard you should be pushing on acquisition.
| LTV/CAC | Interpretation |
|---|
| Below 1 | Losing money on each customer. Pause and fix unit economics. |
| 1–3 | Marginal. Growth is possible but fragile. |
| 3–5 | Healthy. Sustainable growth with room to invest. |
| Above 5 | Strong unit economics, but consider whether you're underinvesting in acquisition. |
A ratio above 5 isn't automatically good. It often means a company is being overly conservative with sales and marketing spend and leaving growth on the table. If your LTV/CAC is consistently above 5, it's worth increasing acquisition investment to accelerate growth.
What drives the LTV/CAC ratio
The ratio is a product of four underlying variables: revenue per account, gross margin, churn, and acquisition cost. Improving any one of them moves the ratio — but the levers have different time horizons.
Churn has the largest leverage. Because LTV is calculated by dividing margin by churn rate, even a small reduction in churn significantly increases LTV. A company with 5% monthly churn has an average customer lifetime of 20 months. Cut churn to 2.5% and that doubles to 40 months.
Gross margin shapes the quality of revenue. Two companies with identical ARPA and churn can have very different LTVs if their margins differ. Infrastructure-heavy SaaS businesses often have lower margins, which compresses LTV even when retention is strong.
CAC is the denominator — but it's easy to undercount. A fully burdened CAC includes salaries, commissions, ad spend, tools, and any onboarding or implementation costs tied to acquisition. Understating CAC inflates the ratio and creates a false sense of efficiency.
LTV/CAC as a growth planning tool
The ratio is most useful as a planning signal, not a reporting metric. It tells you how aggressively to invest in growth.
Early-stage companies (pre-product-market fit): A ratio below 3 often reflects early churn problems or a CAC that hasn't been optimized. Focus on retention and repeatable acquisition channels before scaling spend.
Growth-stage companies: A ratio between 3 and 5 supports confident investment in sales and marketing. Use the ratio alongside CAC Payback Period to understand cash flow timing �— a high LTV/CAC ratio doesn't help if it takes 36 months to recover the acquisition cost.
Scaling companies: As you expand into new segments or geographies, calculate LTV/CAC by cohort or channel. Blended ratios can hide underperforming segments that drag down overall efficiency.
Common mistakes when using LTV/CAC
Using a blended CAC. If you mix organic and paid acquisition into a single CAC figure, you lose visibility into which channels are actually efficient. Break CAC out by channel to identify where to invest more and where to pull back.
Ignoring the payback period. A strong LTV/CAC ratio is a long-run measure. If your payback period is 24+ months, you may face cash flow pressure before the ratio pays off. Track both together.
Treating LTV as certain. LTV is a projection based on current churn and revenue. In early-stage businesses especially, churn is volatile and LTV estimates can shift significantly quarter to quarter. Apply more caution to the ratio when your churn data is thin.
Excluding implementation and support costs from CAC. Any cost that is necessary to convert and onboard a customer belongs in CAC. Leaving these out inflates the ratio and overstates unit economics.
LTV/CAC and related metrics
The LTV/CAC ratio works best alongside a small set of complementary metrics:
Customer Acquisition Cost (CAC): The denominator. Understand what's inside your CAC calculation before trusting the ratio.
Customer Lifetime Value (LTV): The numerator. LTV is a function of retention and margin — improving either improves the ratio.
CAC Payback Period: How long it takes to recover the cost of acquiring a customer. A high LTV/CAC ratio with a long payback period can create cash flow risk.
Churn Rate: The most sensitive input to LTV. Monitor churn closely — it's the fastest way to move the ratio in either direction.