CAC Payback Period is the number of months a company needs to recover its customer acquisition costs through revenue generated by new customers. It combines Customer Acquisition Cost (CAC), Net New MRR, and Gross Margin percentage to measure go-to-market efficiency. The shorter the payback period, the faster a company recycles growth capital.
Example 1 — Enterprise B2B SaaS
Company A sells B2B software with a three-month sales cycle. Sales and marketing expenses in Q1 totalled $1.2M. Net New MRR acquired in Q2 was $275K. Gross Margin is 75%.
CAC Payback Period = $1,200,000 / ($275,000 × 75%) = $1,200,000 / $206,250 = 5.8 months
Company A recovers acquisition costs in under six months — a strong result for enterprise SaaS.
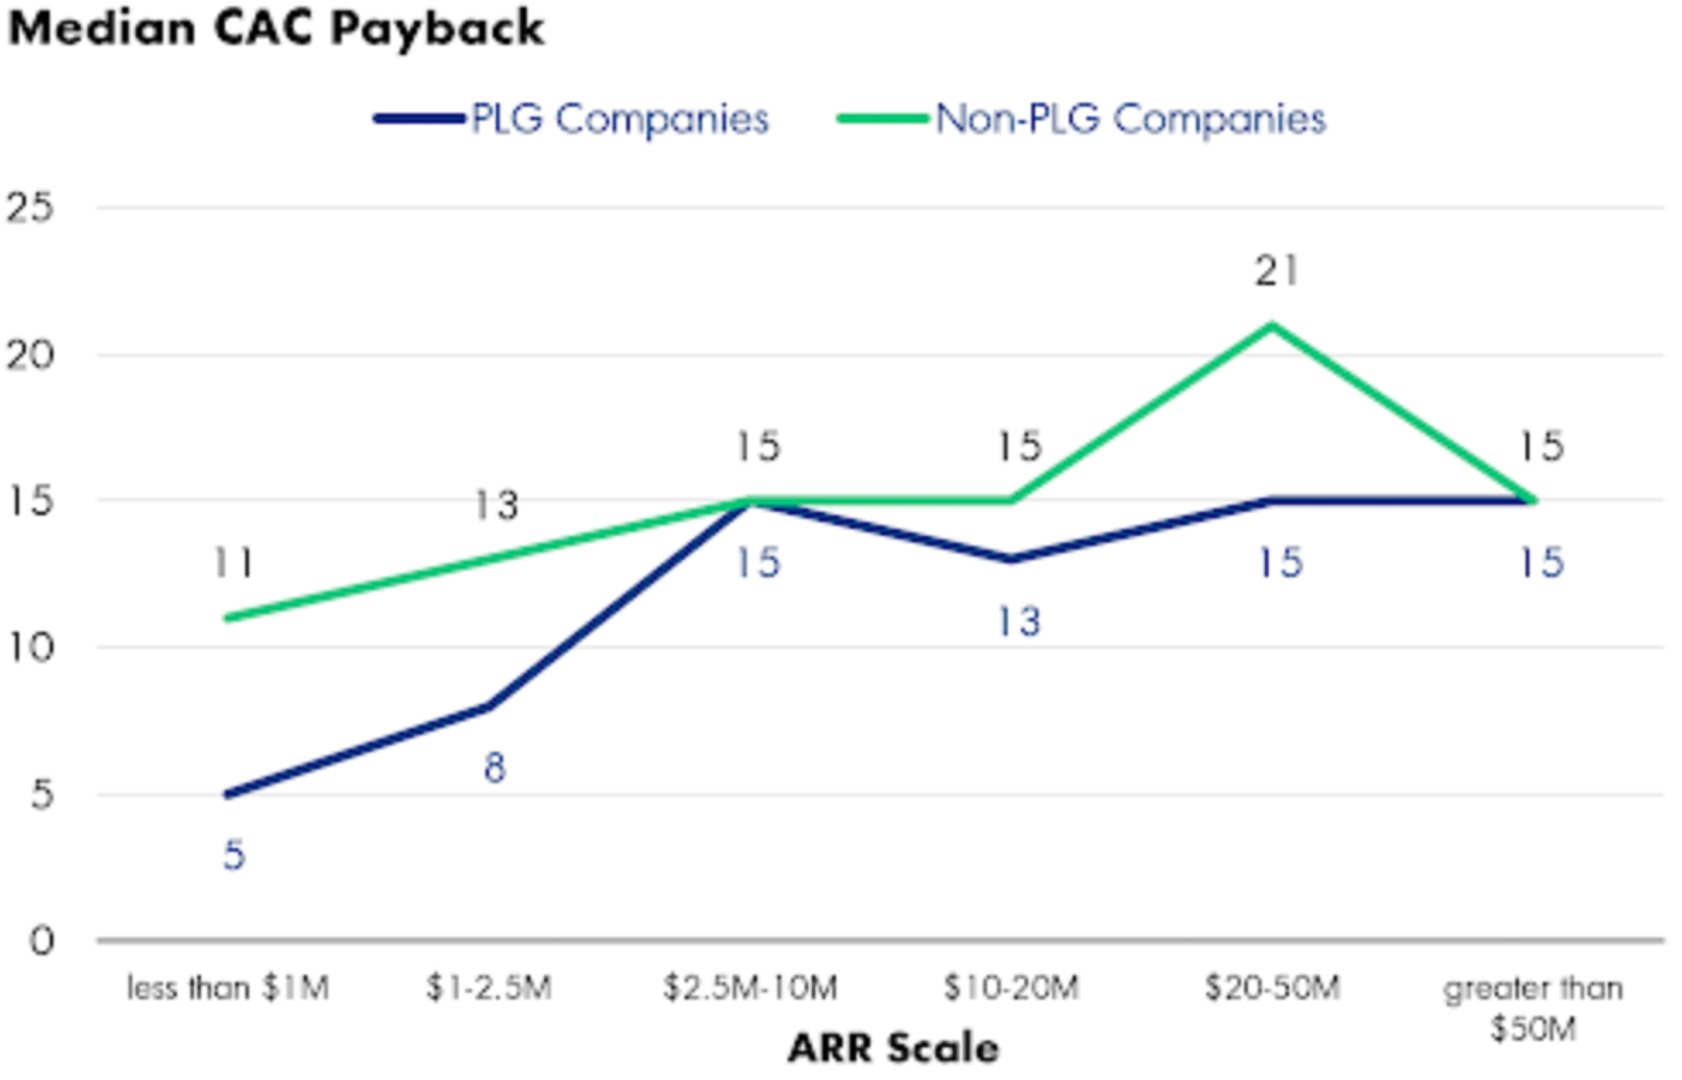
Example 2 — PLG motion
Company B uses a product-led growth model. Average sales and marketing spend per new customer is $400. The average new customer generates $25 MRR ($300 ARR). Gross Margin is 80%.
CAC Payback Period = $400 / ($300 × 80%) = $400 / $240 = 1.67 years (approximately 20 months)
This is within a reasonable range for a PLG business, but signals room to improve acquisition efficiency or average revenue per user.
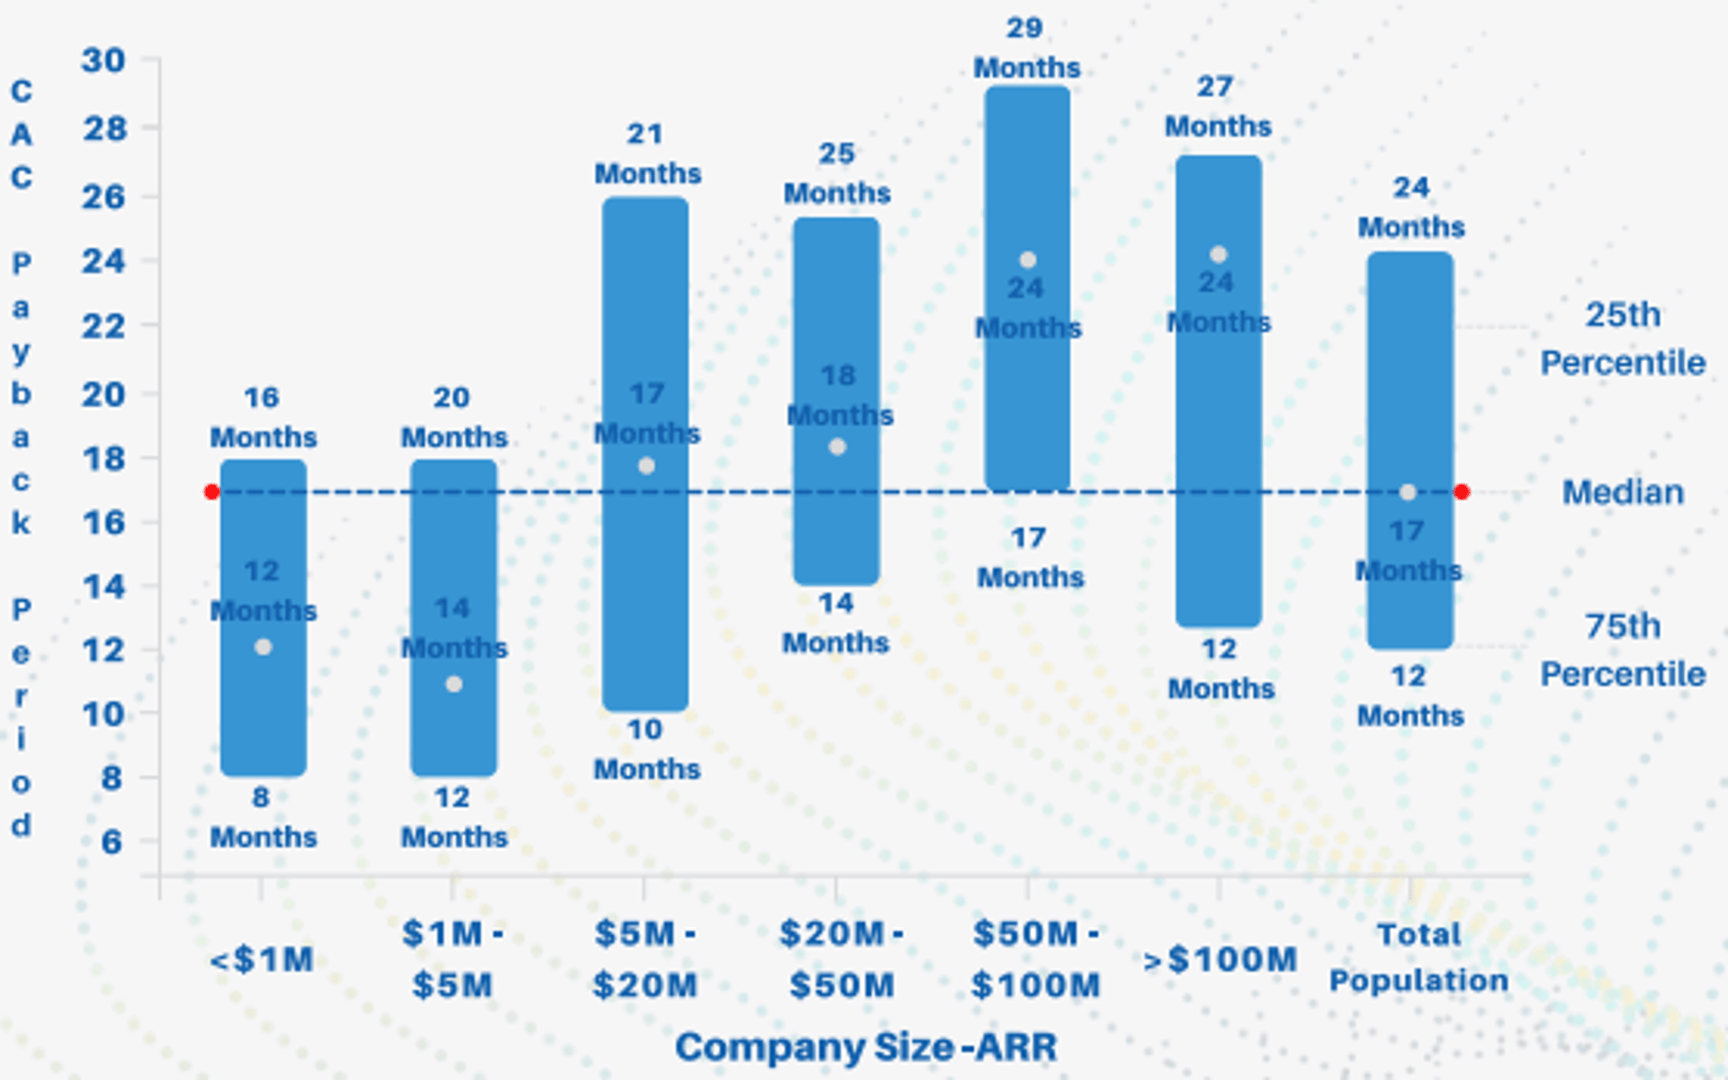
Across the industry, the median CAC Payback Period is 15 to 18 months, with top-quartile performers recovering costs in under 12 months. Best-in-class operators even hit 6 to 8 months.
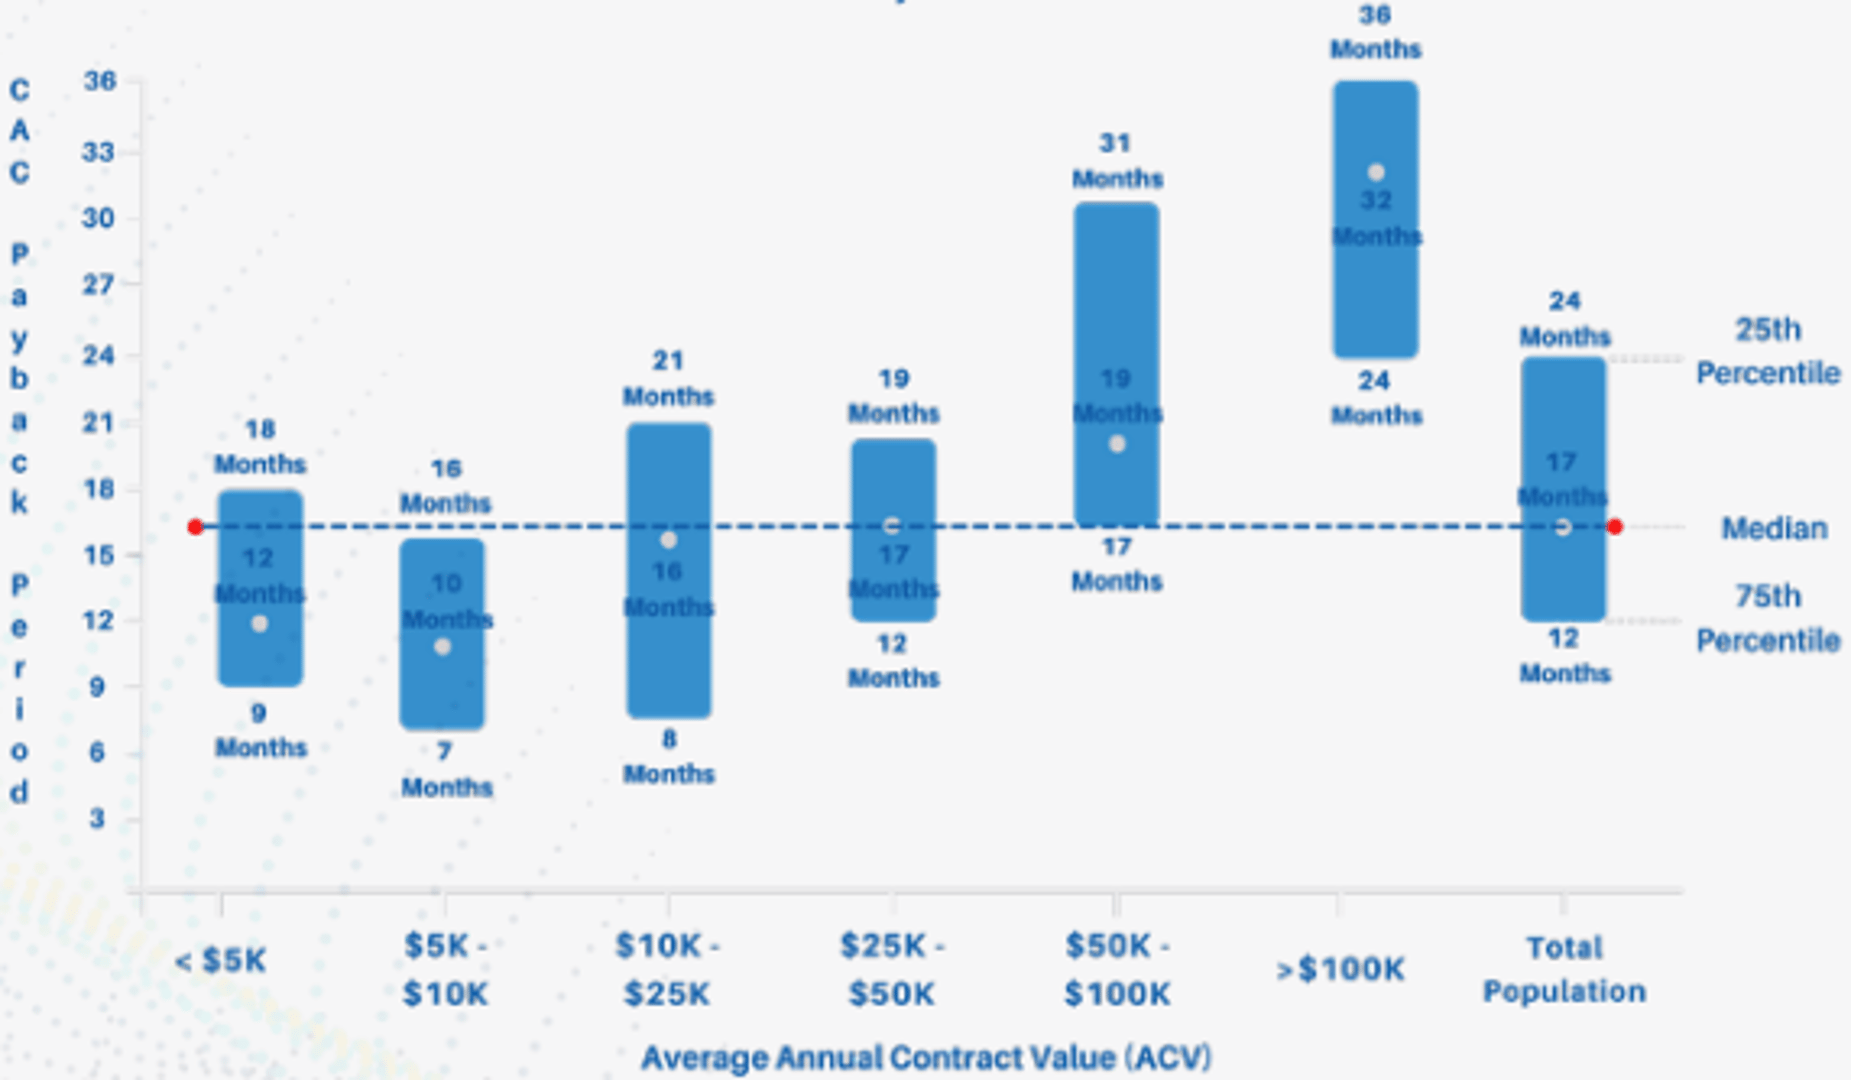
Payback periods vary significantly by the segment you sell into:
SMB SaaS / Self-Serve / PLG (ACV under $15K)
- Median Payback: 8–12 months
- Elite: 2–6 months
Mid-Market SaaS (ACV $15K–$100K)
- Median Payback: 14–18 months
- Elite: 9–12 months
Enterprise SaaS (ACV over $100K)
- Median Payback: 18–24 months
- Elite: 12–18 months
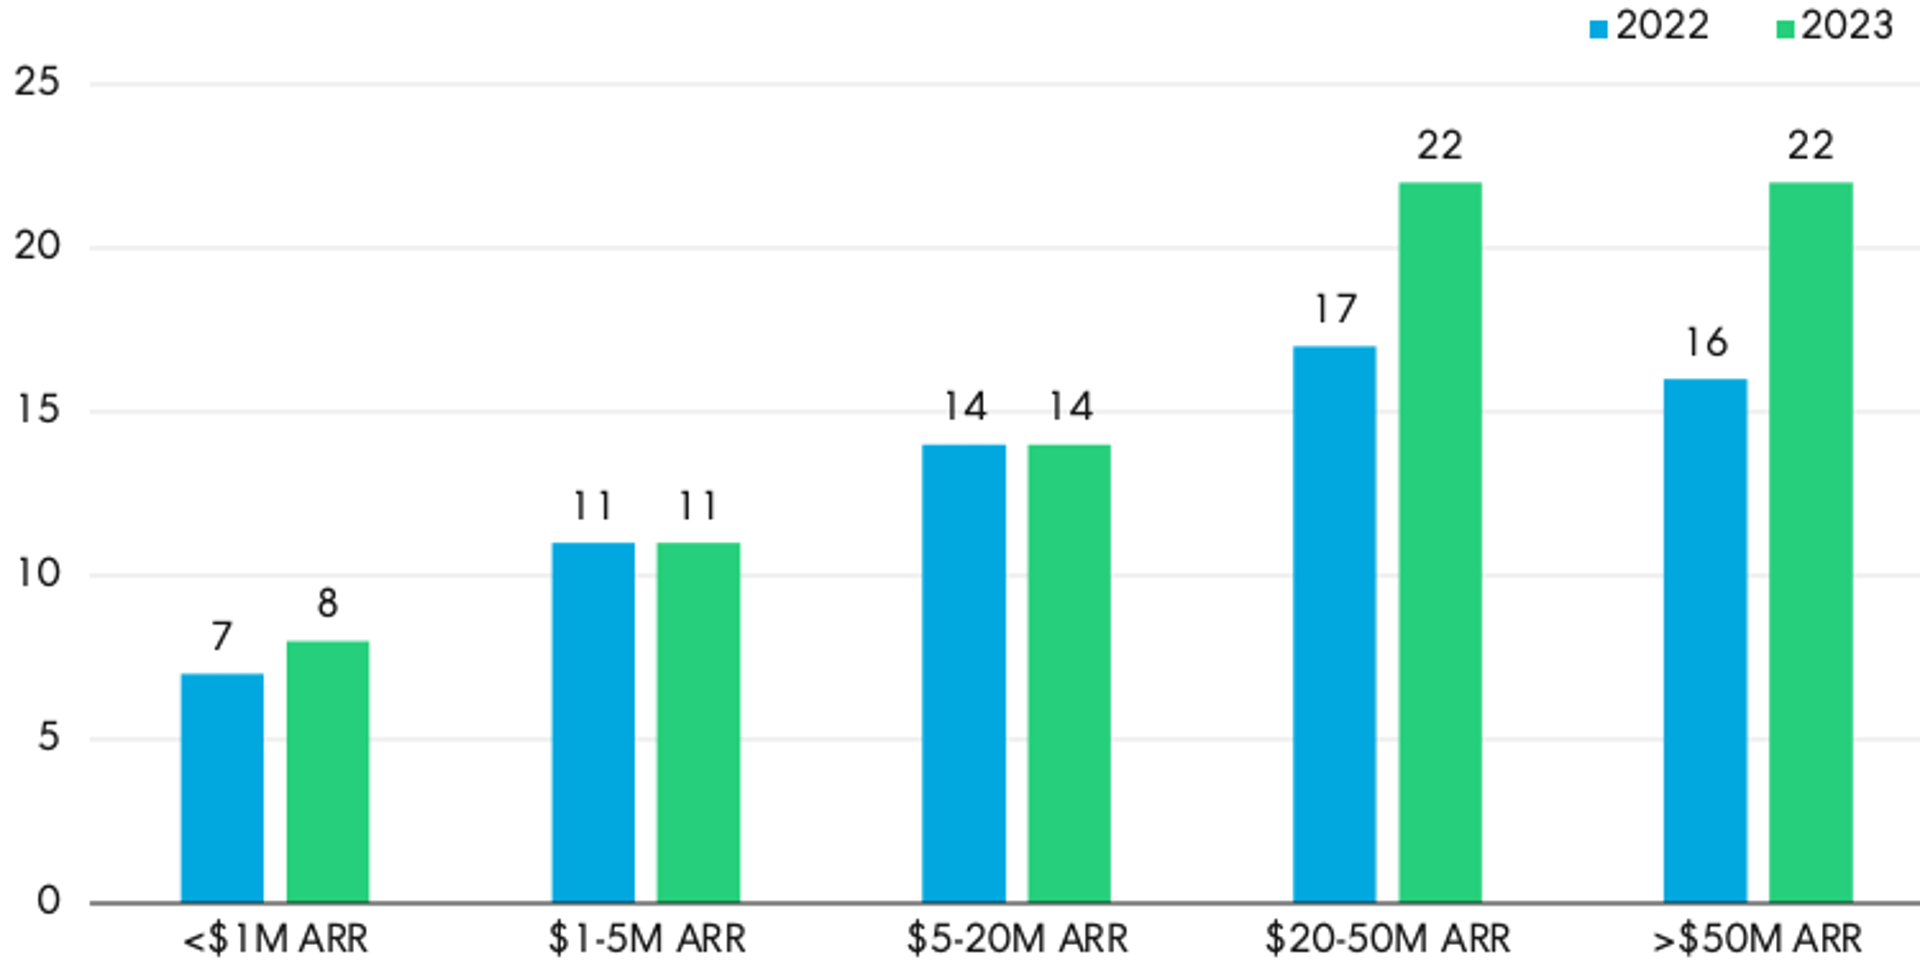
You can visualize CAC Payback Period best with a line chart, which shows changes in trends over time. Ideally, your chart should show a steady or upward trending CAC Payback Period.
CAC Payback Period is one of the clearest signals of go-to-market efficiency. The shorter the payback period, the better the strategy. SaaS companies typically target 12–18 months to recover CAC, while high-performing companies often achieve 5–7 months.
CAC Payback Period combines three fundamental metrics: Customer Acquisition Cost (CAC), the all-inclusive sales and marketing cost incurred in a period; Net New MRR acquired from new customers in that period; and your overall Gross Margin percentage.
Why CAC Payback Period matters
This metric is especially important for cash planning, growth decisions, and investor conversations. If your average payback period is 10 months and you sell annual plans paid upfront, you recover acquisition costs immediately — cash in the bank that you don't need to finance through debt or equity. A shorter payback period also gives you more confidence to scale acquisition spend.
How CAC Payback Period relates to other metrics
CAC Payback Period does not account for churn. It assumes the customer remains long enough to recover acquisition costs. Customers who churn before the payback period ends represent a net loss.
Track CAC Payback Period alongside:
- LTV:CAC Ratio: Measures the total return on acquisition investment over a customer's lifetime.
- Customer Churn Rate: If churn is elevated, a short payback period becomes more critical.
- Net Revenue Retention (NRR): Expansion revenue can shorten the effective payback period over time.
Understanding CAC Payback Period also helps you decide how aggressively to pursue annual or multi-year plans versus monthly plans, which typically carry higher churn.
What affects CAC Payback Period
Factors that lengthen payback: high sales and marketing spend relative to new revenue, long sales cycles, low average contract values, and low gross margins.
Factors that shorten payback: efficient demand generation, higher ACV or upfront annual contracts, improved gross margins, and faster onboarding that reduces early churn.
Common mistakes when measuring CAC Payback Period
Including the wrong costs in CAC. CAC should include all sales and marketing expenses — salaries, tools, agency fees, and ad spend. Understating CAC produces an artificially short payback period.
Ignoring the sales cycle lag. If your average sales cycle is three months, expenses in Q1 generate revenue in Q2. Match the cost period to the revenue period for an accurate result.
Using revenue instead of gross margin. Dividing by MRR alone ignores the cost to deliver that revenue. Gross margin-adjusted CAC Payback Period reflects real profit recovery, not just revenue recovery.
Treating it as a standalone metric. CAC Payback Period is most useful alongside churn rate and LTV. A 12-month payback period looks very different depending on whether average customer lifetime is 18 months or 5 years.