Net Revenue Retention (NRR) Rate, also known as Net Dollar Retention (NDR), is the percentage of recurring revenue retained from existing customers in a defined time period, including expansion revenue, downgrades, and cancels. This churn metric gives a comprehensive view of positive as well as negative changes with respect to customer retention.
Here's an example of how to calculate Net Revenue Retention (NRR). We'll call this scenario A: A company has 100 customers, each paying $2,000 per month. MRR at the beginning of the month is $200,000. Within the month, 1 customer adds a $4,000 MRR upgrade, 2 downgrade by $500 each, and 1 customer cancels.
Based on the Net Dollar Retention formula, NRR = ($200,000 + $4,000 - ($500 x 2) - $2,000) / $200,000 = $201,000 / $200,000 = 100.5% expressed monthly
Now let's look at Scenario B: Another company has 100 customers paying $20,000 for annual subscriptions. Within a one month period, 10 customers are due for renewal, only 9 actually renew, 1 adds a $5000 ARR upgrade, and 2 downgrade their subscription by $2000 each.
Net Dollar Retention = ($20,000 x 9) + $5,000 - ($2,000 x 2)) / ($2,000 MRR x 10) = $19,000 / $20,000 = 95.0% expressed monthly
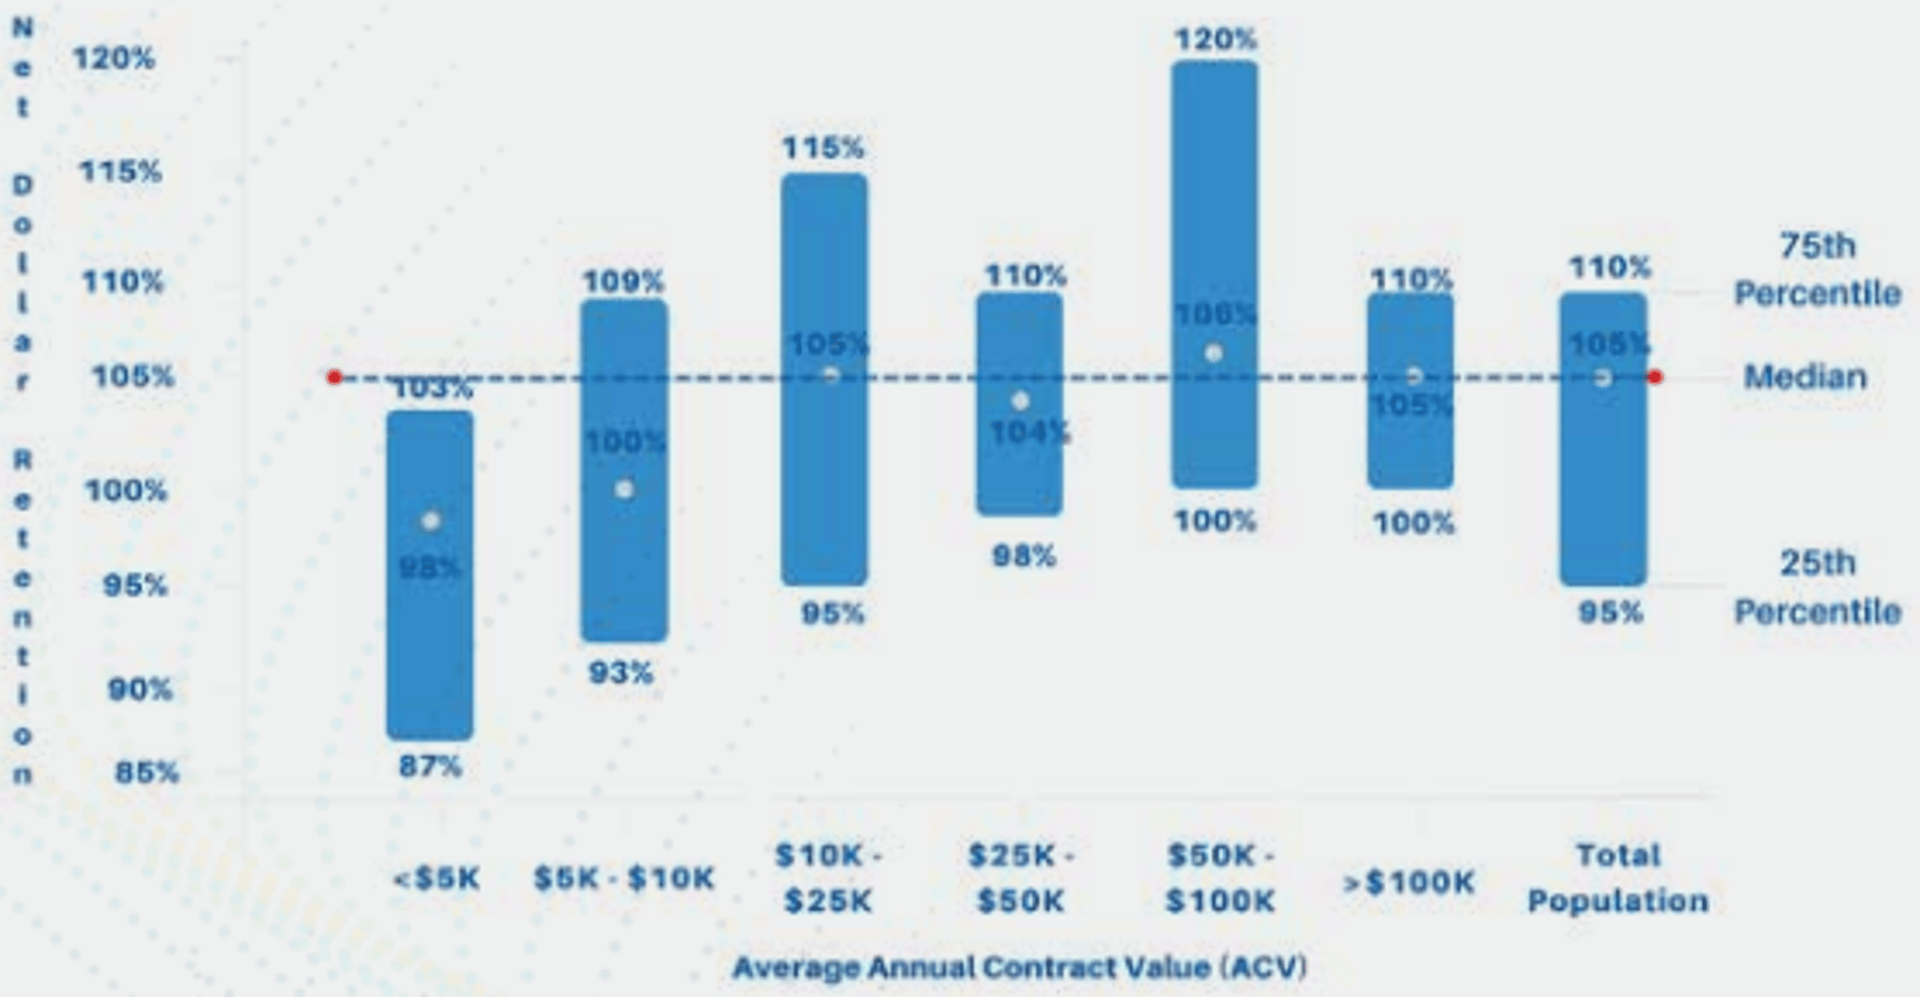
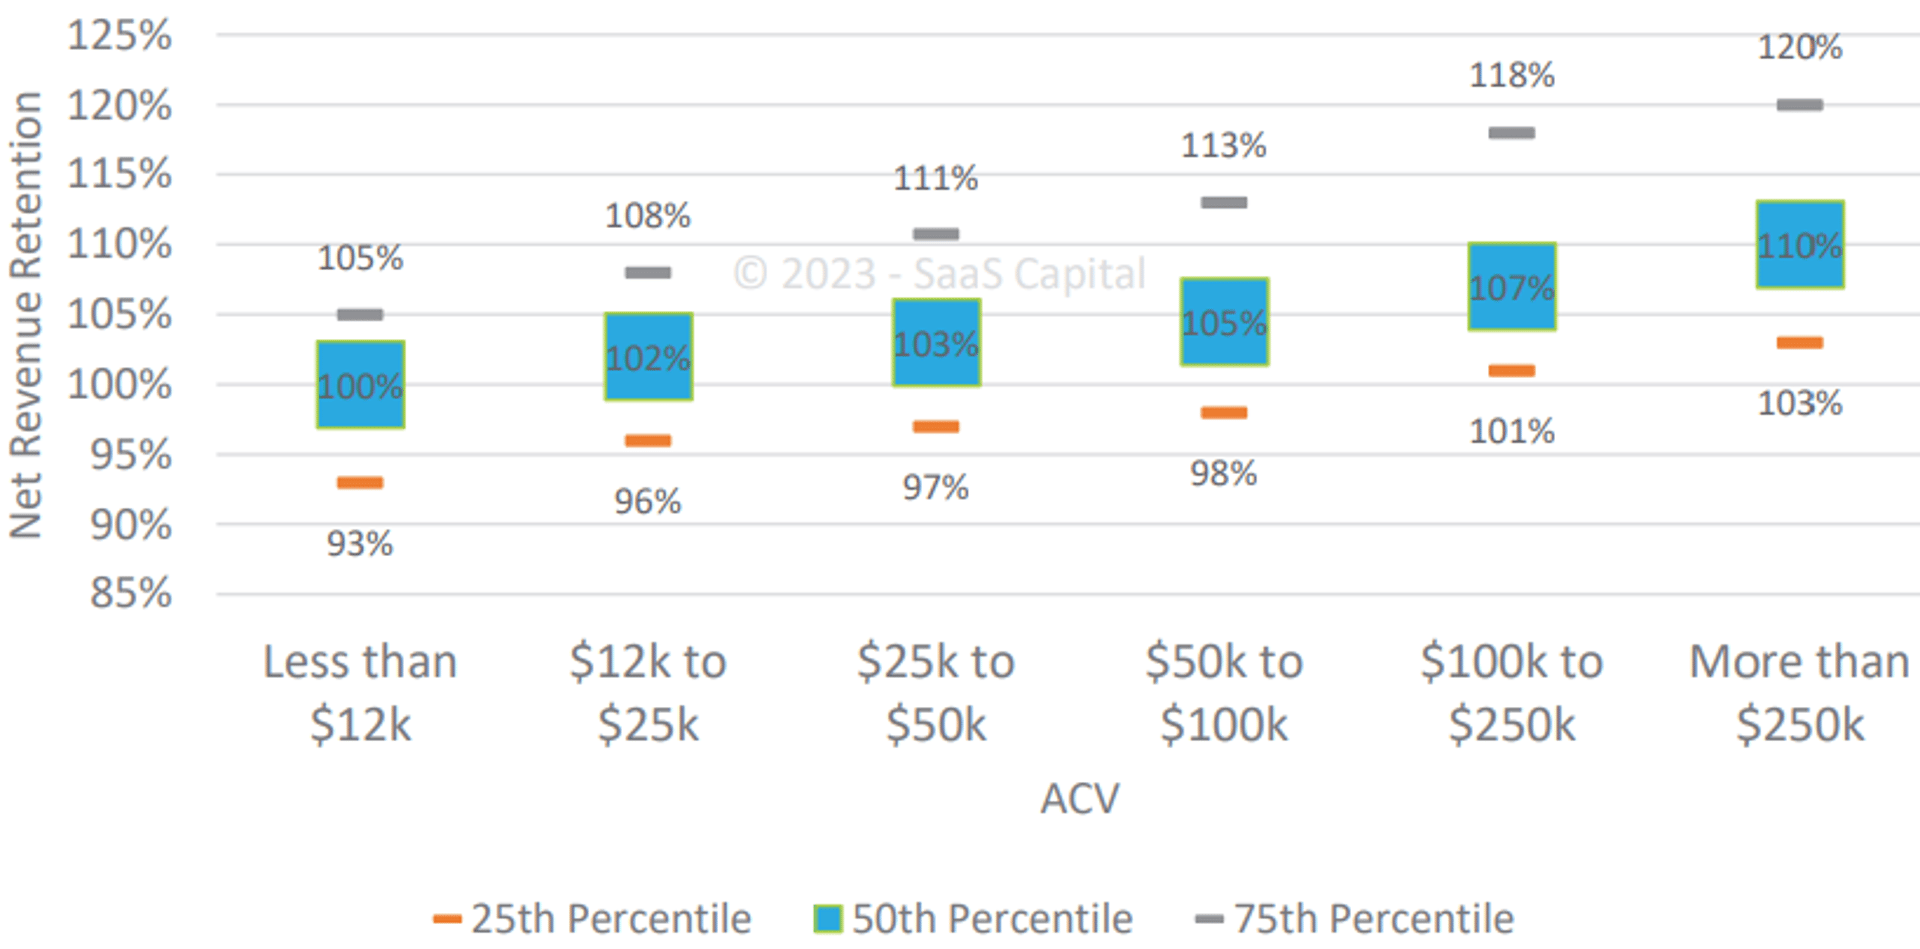
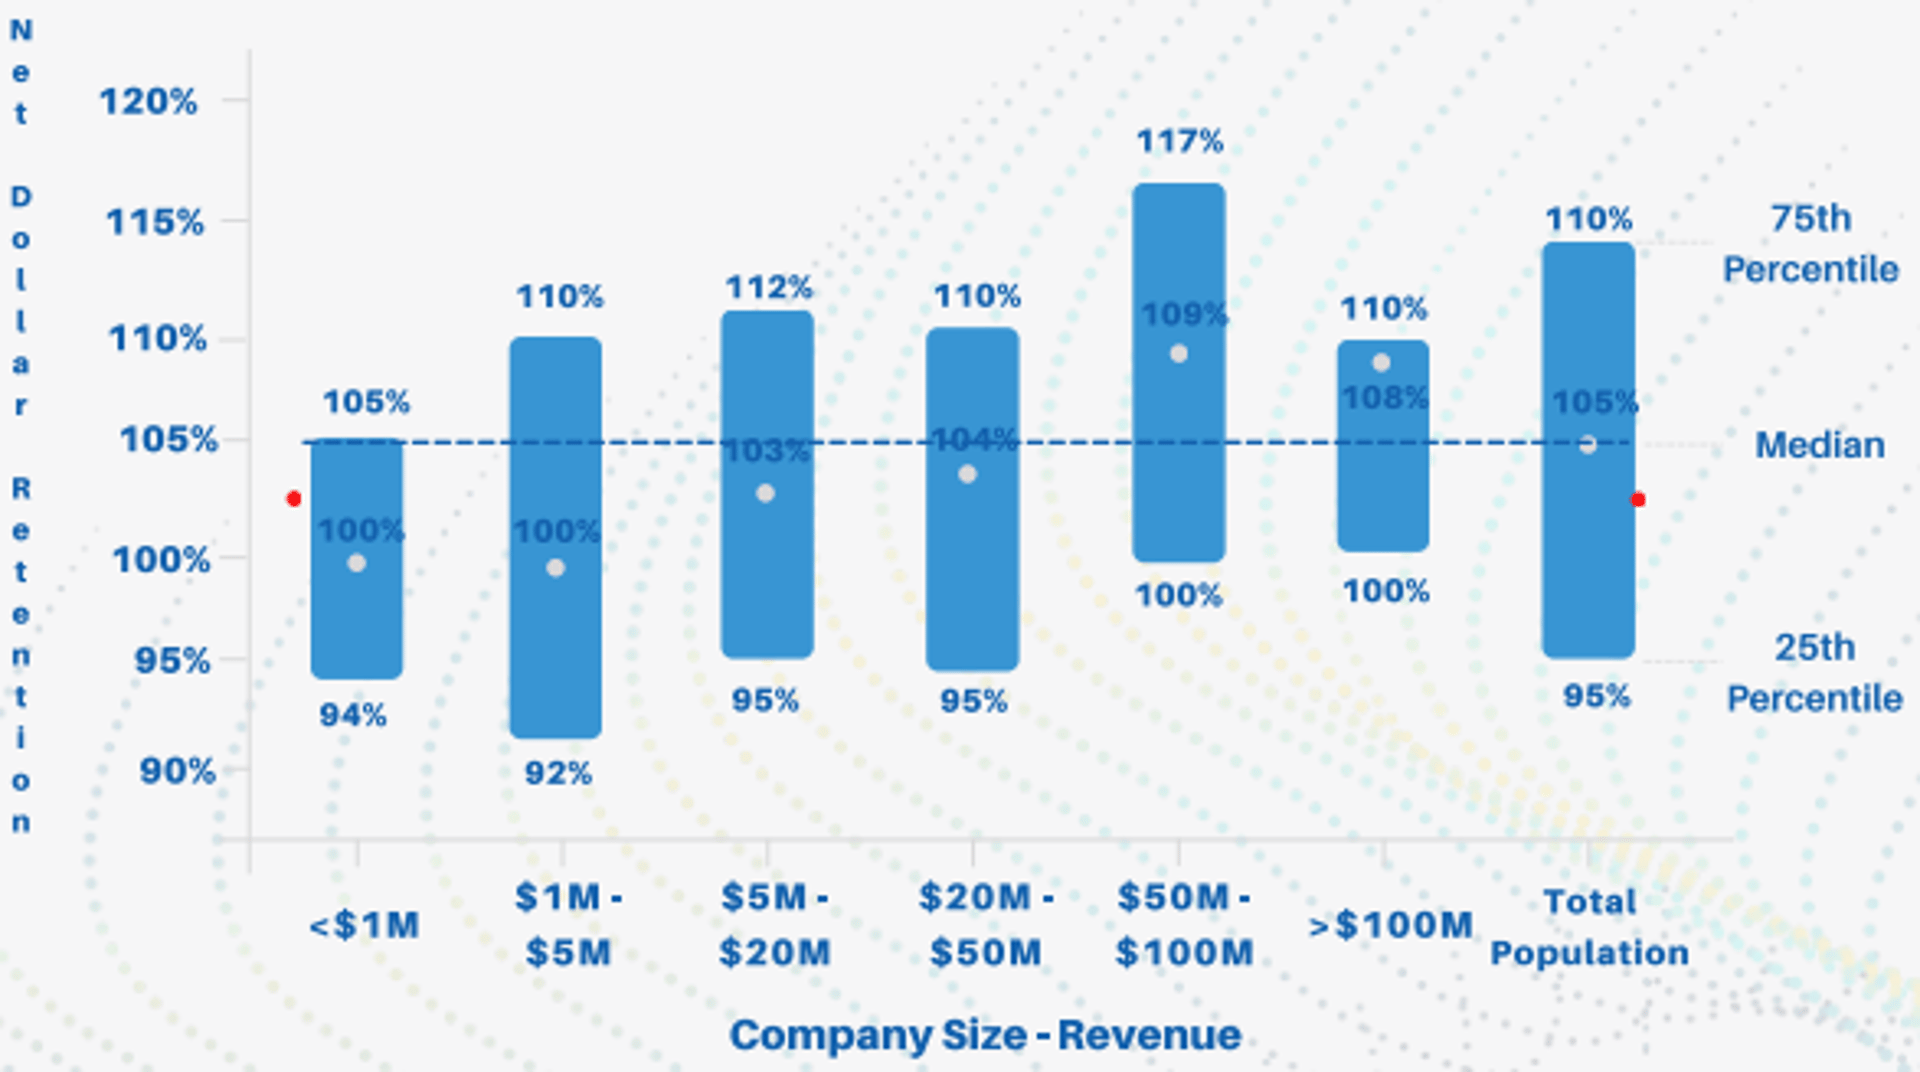
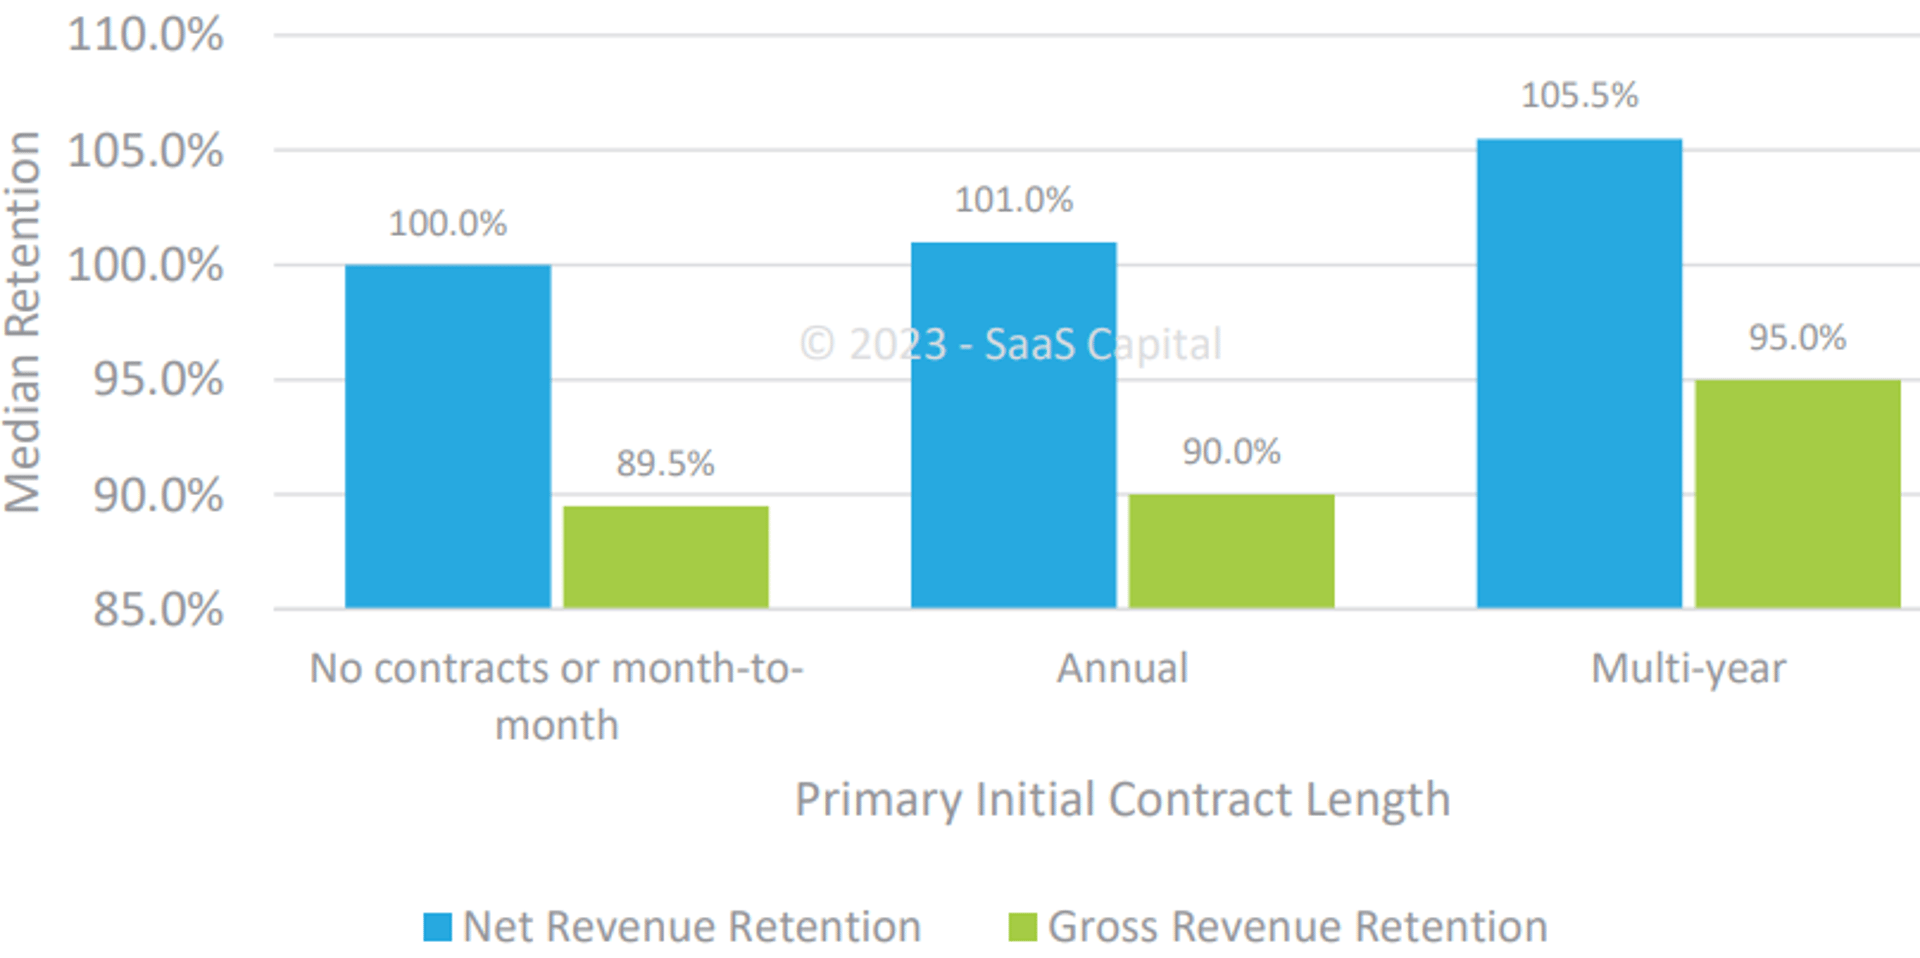
In a SaaS business, a Net Revenue Retention Rate >100% is a growth indicator. Across all SaaS companies, the median Net Retention Rate is 103% to 105%. Higher Annual Contract Value (ACV) products have higher Net Retention Rates. For SaaS companies selling into small and medium businesses (SMBs), a good Net Retention Rate is 90%. For Enterprise SaaS, 125% is considered a good Net Retention Rate.
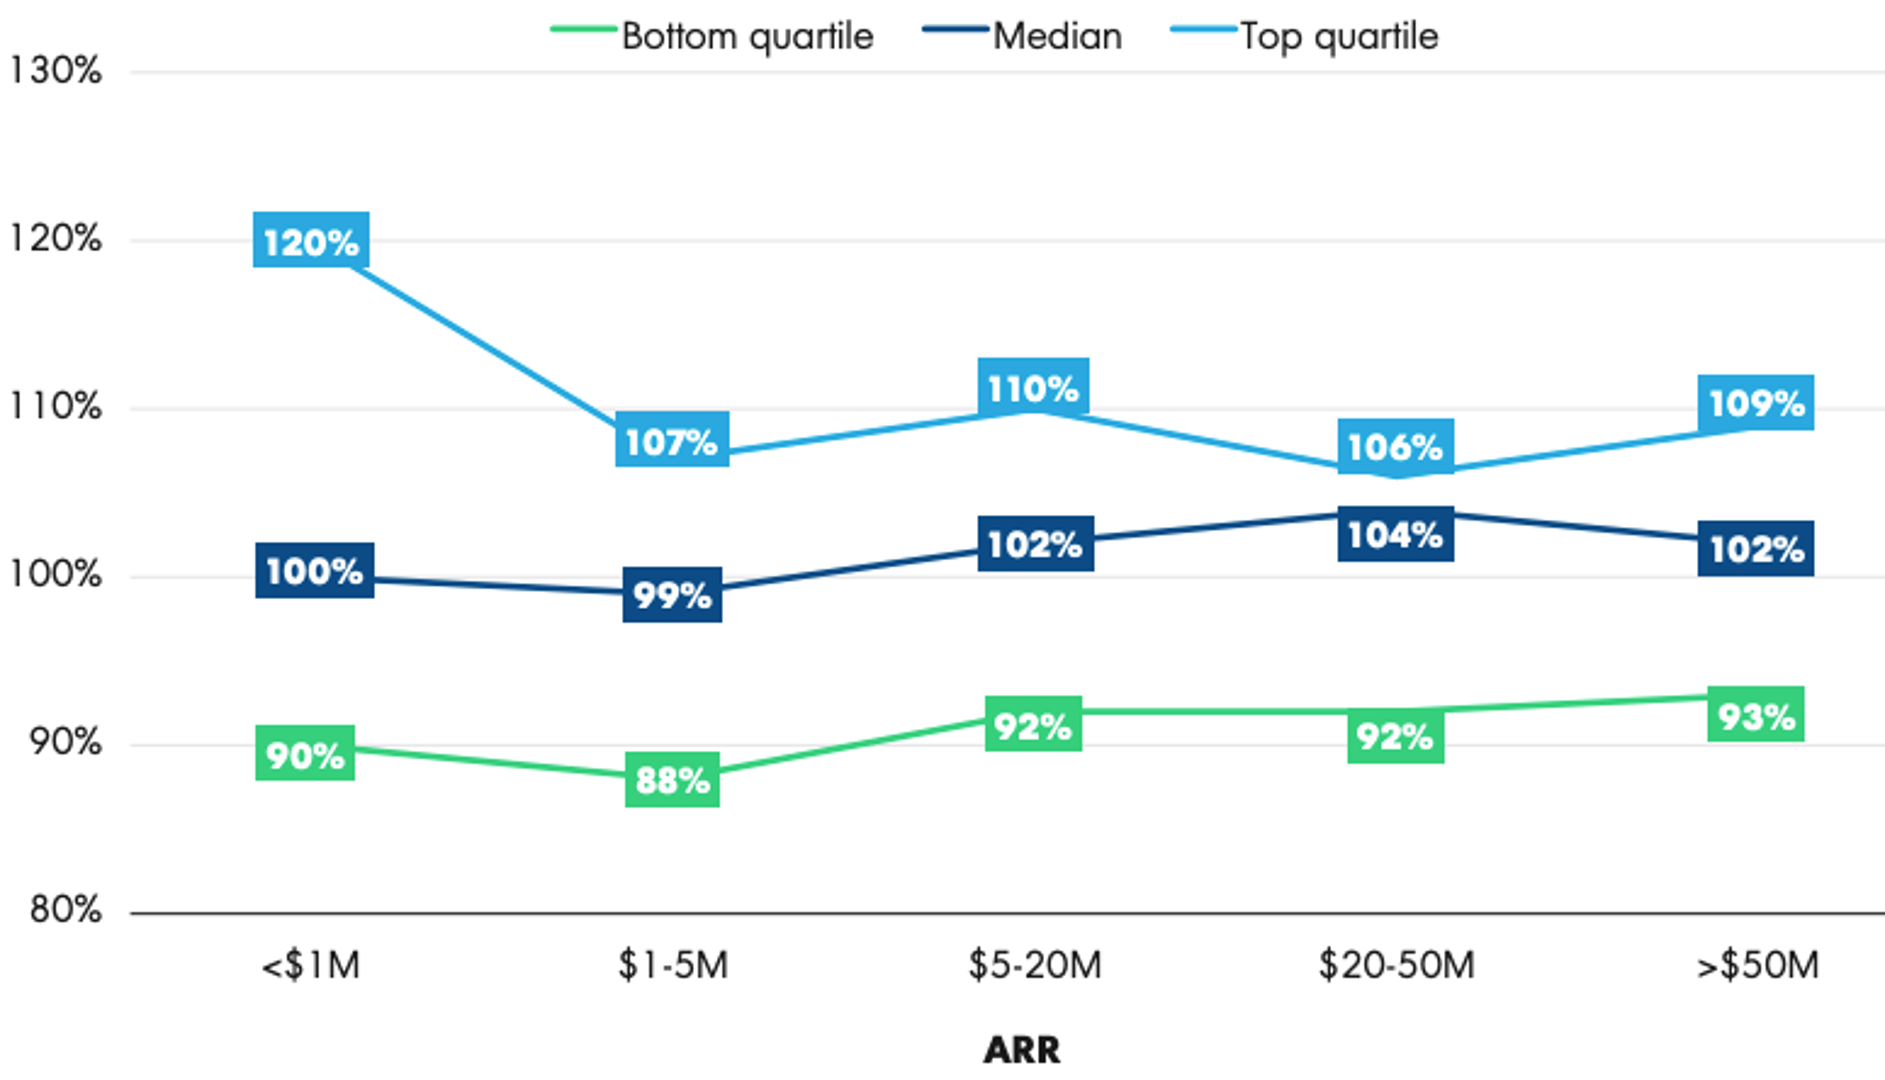
When looking at its portfolio of companies scaling to $10M in ARR, Bessemer Venture Partners reports the bottom quartile at less than 105%, the middle at 140%, and the top at greater than 145% NRR. April 2022.
In most cases, Net Revenue Retention Rate is tracked monthly or yearly. Although you achieve a fuller picture of retention by tracking both dollar and customer retention, NRR can be a great place to start. Remember to review your NRR percentage at least on a monthly basis to stay informed of negative (and positive!) fluctuations and their impact on your revenue. Take a look at the chart to understand what it looks like when you start tracking NRR regularly:
Net Revenue Retention isn't just a retention metric—it's a compound growth engine that reveals the true health of your business model. Unlike other metrics that capture point-in-time snapshots, NRR tells the story of your customers' evolving relationship with your product and their willingness to invest more over time.
A high NRR indicates that your product creates increasing value as customers mature, suggesting strong product-market fit and predictable growth. More importantly, NRR above 100% means you can grow revenue even with zero new customer acquisition—a powerful competitive moat that creates exponential growth potential.
The Strategic Decision Framework
Investment Prioritization Matrix
Your annualized NRR performance should dictate your strategic priorities and resource allocation. Each NRR range requires fundamentally different approaches to customer success, product development, and growth investments. Companies that align their strategies with their NRR reality achieve faster improvement and avoid the common mistake of pursuing expansion before solving retention fundamentals. Here's how to structure your priorities based on your current annualized NRR performance:
Annualized NRR 90-100%: Retention Crisis Mode
- Immediately audit customer health scoring and early warning systems
- Shift 70% of customer success resources to at-risk account management
- Implement emergency customer feedback loops to identify product gaps
- Consider pricing model adjustments or value proposition realignment
- Delay major expansion initiatives until retention stabilizes
Annualized NRR 100-110%: Foundation Building
- Invest heavily in customer success automation and playbooks
- Develop systematic expansion identification and execution processes
- Build robust customer health dashboards with predictive analytics
- Create structured onboarding and adoption programs
- Begin testing expansion offerings and use case identification
Annualized NRR 110-130%: Growth Acceleration
- Scale customer success team with specialized expansion roles
- Develop multi-product or platform expansion strategies
- Implement advanced segmentation for personalized growth paths
- Create customer advisory boards and co-innovation programs
- Invest in product usage analytics and expansion trigger identification
Annualized NRR 130%+: Market Leadership
- Focus on market expansion and competitive differentiation
- Develop ecosystem and partnership expansion opportunities
- Create thought leadership and community-driven growth
- Optimize for enterprise and strategic account penetration
- Consider adjacent market or product line extensions
Advanced NRR Analysis Techniques
Cohort-Based NRR Analysis
Track NRR by customer cohort (acquisition month/quarter) to identify:
- Which acquisition channels produce the highest-expanding customers
- Seasonal patterns in expansion behavior
- The impact of product changes on different customer vintages
- Long-term expansion trajectories and lifetime value predictions
Segmented NRR Insights
Break down NRR by critical dimensions:
Understanding your overall annualized NRR is just the starting point—the real strategic insights come from analyzing how different customer segments, usage patterns, and engagement models drive varying retention and expansion behaviors. This segmented analysis reveals where to focus your improvement efforts and which successful patterns to replicate across your customer base. Each dimension provides specific insights that inform different aspects of your go-to-market strategy:
By Customer Segment:
- Enterprise vs SMB expansion patterns reveal different growth strategies
- Industry-specific NRR helps prioritize vertical investments
- Geographic NRR identifies market maturity and local competitive dynamics
By Product/Feature Usage:
- High-usage customers typically show higher NRR, revealing value drivers
- Feature adoption correlation with expansion guides product development
- Usage pattern analysis predicts expansion timing and opportunity size
By Customer Success Touchpoints:
- Customers with regular check-ins show 15-25% higher NRR
- Training program participants expand 40% more frequently
- Executive relationship presence correlates with larger expansion deals
Leading Indicators and Predictive Analytics
Transform NRR from a lagging indicator to a predictive tool:
While annualized NRR tells you what happened over the past year, building a predictive NRR model requires identifying the behavioral signals and usage patterns that precede expansion and churn events. By tracking these leading indicators, you can intervene proactively to drive expansion opportunities and prevent downgrades before they occur. The key is establishing correlation patterns between current customer behaviors and future NRR outcomes, allowing you to forecast and influence your NRR trajectory:
90-Day NRR Predictors:
- Product usage velocity changes (20%+ increase typically precedes expansion)
- Support ticket sentiment and resolution time trends
- Contract utilization rates (80%+ utilization predicts expansion needs)
- User seat growth within existing accounts
Early Warning Systems:
- Usage decline patterns that precede downgrades
- Support escalation frequencies that predict churn
- Payment delay patterns and renewal negotiation behaviors
- Stakeholder engagement score deterioration
Operational Excellence in NRR Management
The Expansion Revenue Engine
Systematic Opportunity Identification:
- Implement automated triggers based on usage patterns, user growth, and engagement scores
- Create expansion opportunity scoring models that prioritize highest-probability deals
- Develop expansion playbooks for common scenarios (new use cases, team growth, geographic expansion)
Cross-Functional Alignment:
- Sales and Customer Success must share expansion pipeline and coordinate outreach
- Product teams should receive regular feedback on feature requests driving expansion
- Support teams should flag expansion opportunities discovered during problem resolution
Revenue Operations Excellence:
- Track expansion pipeline health with the same rigor as new business pipeline
- Implement expansion revenue forecasting with confidence intervals
- Create expansion deal velocity and win rate tracking by segment and rep
Benchmarking and Goal Setting
Industry Context: Your annualized NRR goals should reflect your market reality. B2B marketplaces and platforms typically achieve higher annualized NRR (120-150%) than single-point solutions (95-115%). Enterprise software with network effects can sustain annualized NRR of 130%+ , while transactional tools often plateau at 105-110%.
Growth Stage Considerations:
- Early-stage companies should prioritize NRR stability over optimization
- Scale-stage companies should target segment-specific NRR improvements
- Mature companies should focus on NRR consistency and predictability
Competitive Intelligence: Monitor public company NRR disclosures in your category to understand market dynamics and set realistic benchmarks. Companies like Snowflake (annualized NRR 160%+), MongoDB (annualized NRR 120%+), and Zoom (annualized NRR 130%+) demonstrate category-leading performance.
Common NRR Pitfalls and Solutions
The "Growth at Any Cost" Trap
High NRR driven by unsustainable discounting or premature upselling creates artificial inflation. Focus on value-based expansion where customers genuinely derive increased utility from higher-tier offerings.
The "One-Size-Fits-All" Mistake
Applying uniform expansion strategies across all customer segments dilutes effectiveness. Enterprise customers expand through strategic initiatives, while SMBs expand through usage-driven needs. Tailor your approach accordingly.
The "Timing Disconnection" Problem
Many teams track NRR monthly but manage expansion quarterly or annually. Align your measurement cadence with your expansion sales cycle for more actionable insights.
Strategic Implications for Business Building
Funding and Valuation Impact: Investors increasingly value companies with annualized NRR >120% at premium multiples (often 20-40% higher) because they demonstrate organic growth potential and reduced dependency on expensive customer acquisition.
Go-to-Market Strategy: High NRR enables a "land and expand" motion where you can acquire customers with lower initial deal sizes, reducing sales friction and accelerating pipeline velocity while counting on expansion to drive lifetime value.
Product Development Prioritization: NRR analysis reveals which features and capabilities drive the most expansion revenue, helping product teams prioritize development resources on high-impact initiatives rather than feature breadth.
Organizational Design: Companies with annualized NRR >115% should consider dedicated expansion sales roles rather than having account managers handle both retention and growth. This specialization typically increases expansion deal velocity by 25-40%.
The Compound Effect of NRR Excellence
The mathematical power of high annualized NRR compounds over time. A SaaS company with annualized NRR of 120% grows its revenue base 2.5x over five years from existing customers alone, while a company with annualized NRR of 95% sees its base shrink to 77% of original size. This difference becomes the primary determinant of long-term market leadership and profitability.
Master NRR, and you master the fundamental engine of SaaS growth. Every percentage point improvement in NRR creates exponential value that flows directly to enterprise value and competitive positioning.