Net Monthly Recurring Revenue (MRR) Churn Rate is the percentage change in MRR from existing customers due to expansions, cancellations, and downgrades. A negative Net MRR Churn Rate occurs when expansions exceed downgrades and cancellations and is a strong positive indicator of company health. This metric is typically expressed as a monthly rate, although it can also be calculated as an annual rate: Net Annual Recurring Revenue (ARR) Churn Rate.
ƒ Sum(downgraded MRR + cancelled MRR - expanded MRR) / (total MRR at the beginning of the month)
Example A: A company's starting MRR is $50,000 with expansions of $7,000 and downgrades and cancellations of $10,000.
The Net MRR Churn Rate is ($10,000 - $7,000) ÷ $50,000 = 6.0%
Example B: A company's starting MRR is $100,000 with expansions of $12,000 and downgrades and cancellations of $7,000.
The Net MRR Churn Rate is ($7,000 - $12,000) ÷ $100,000 = -5.0%
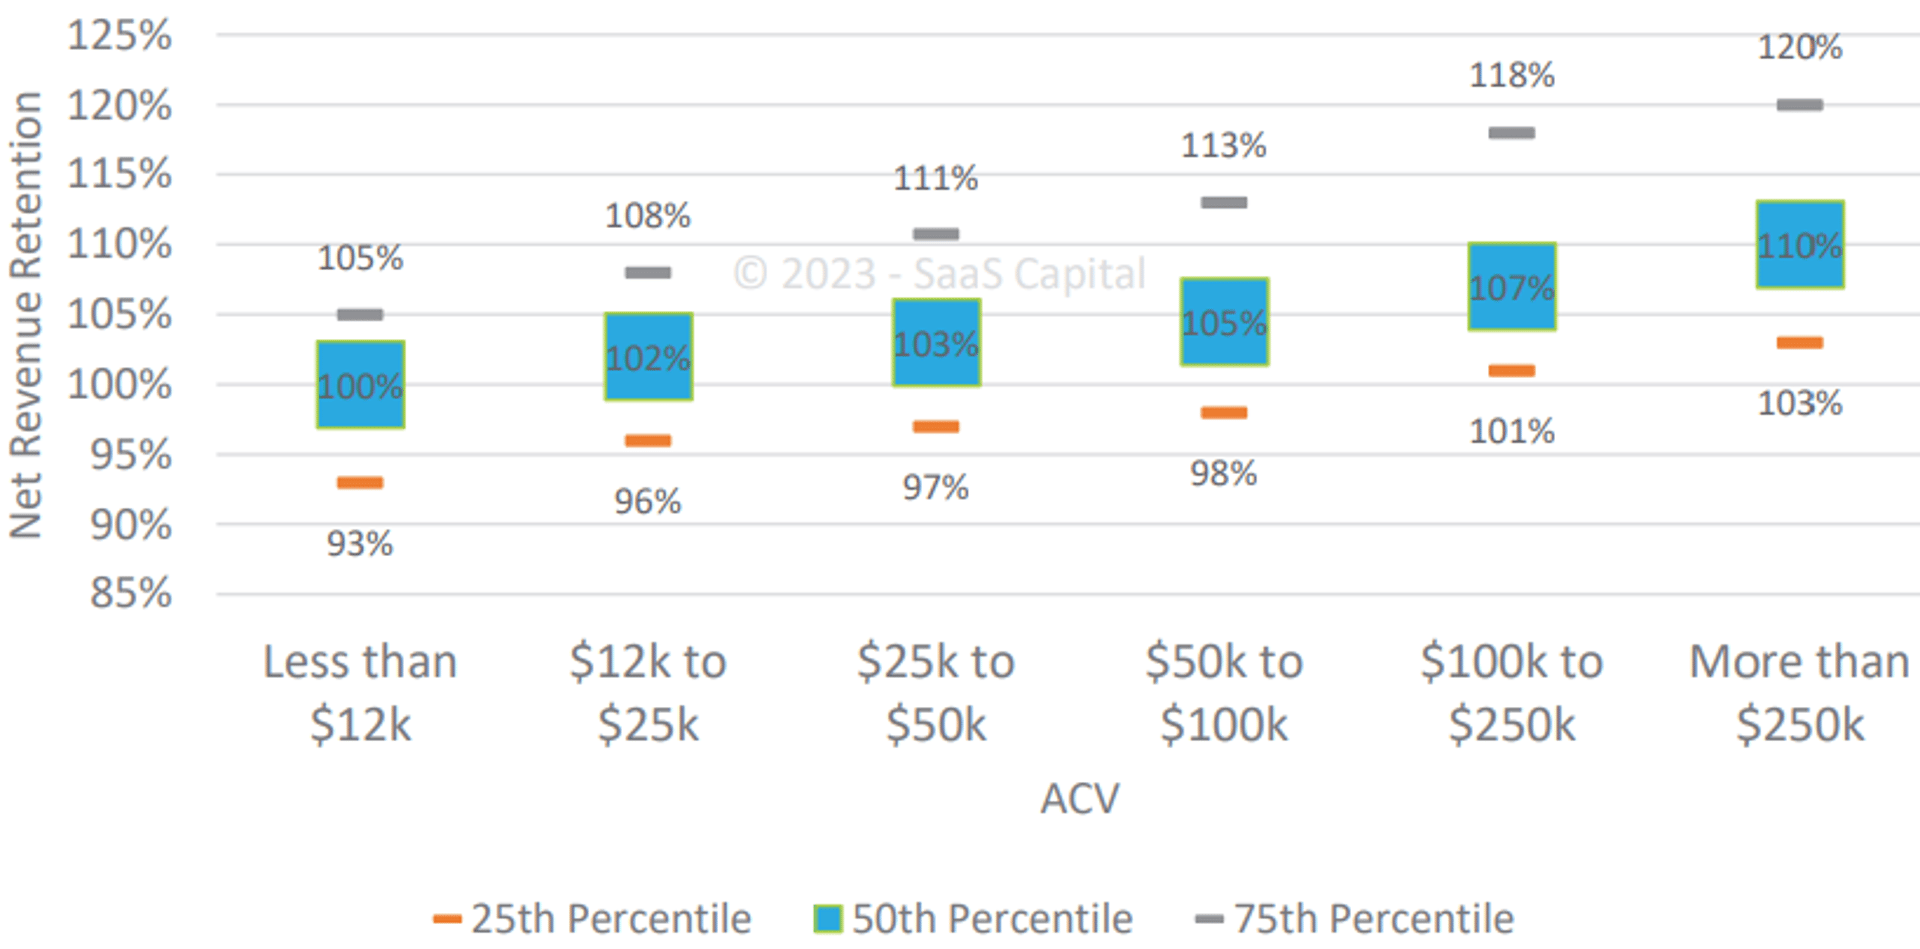
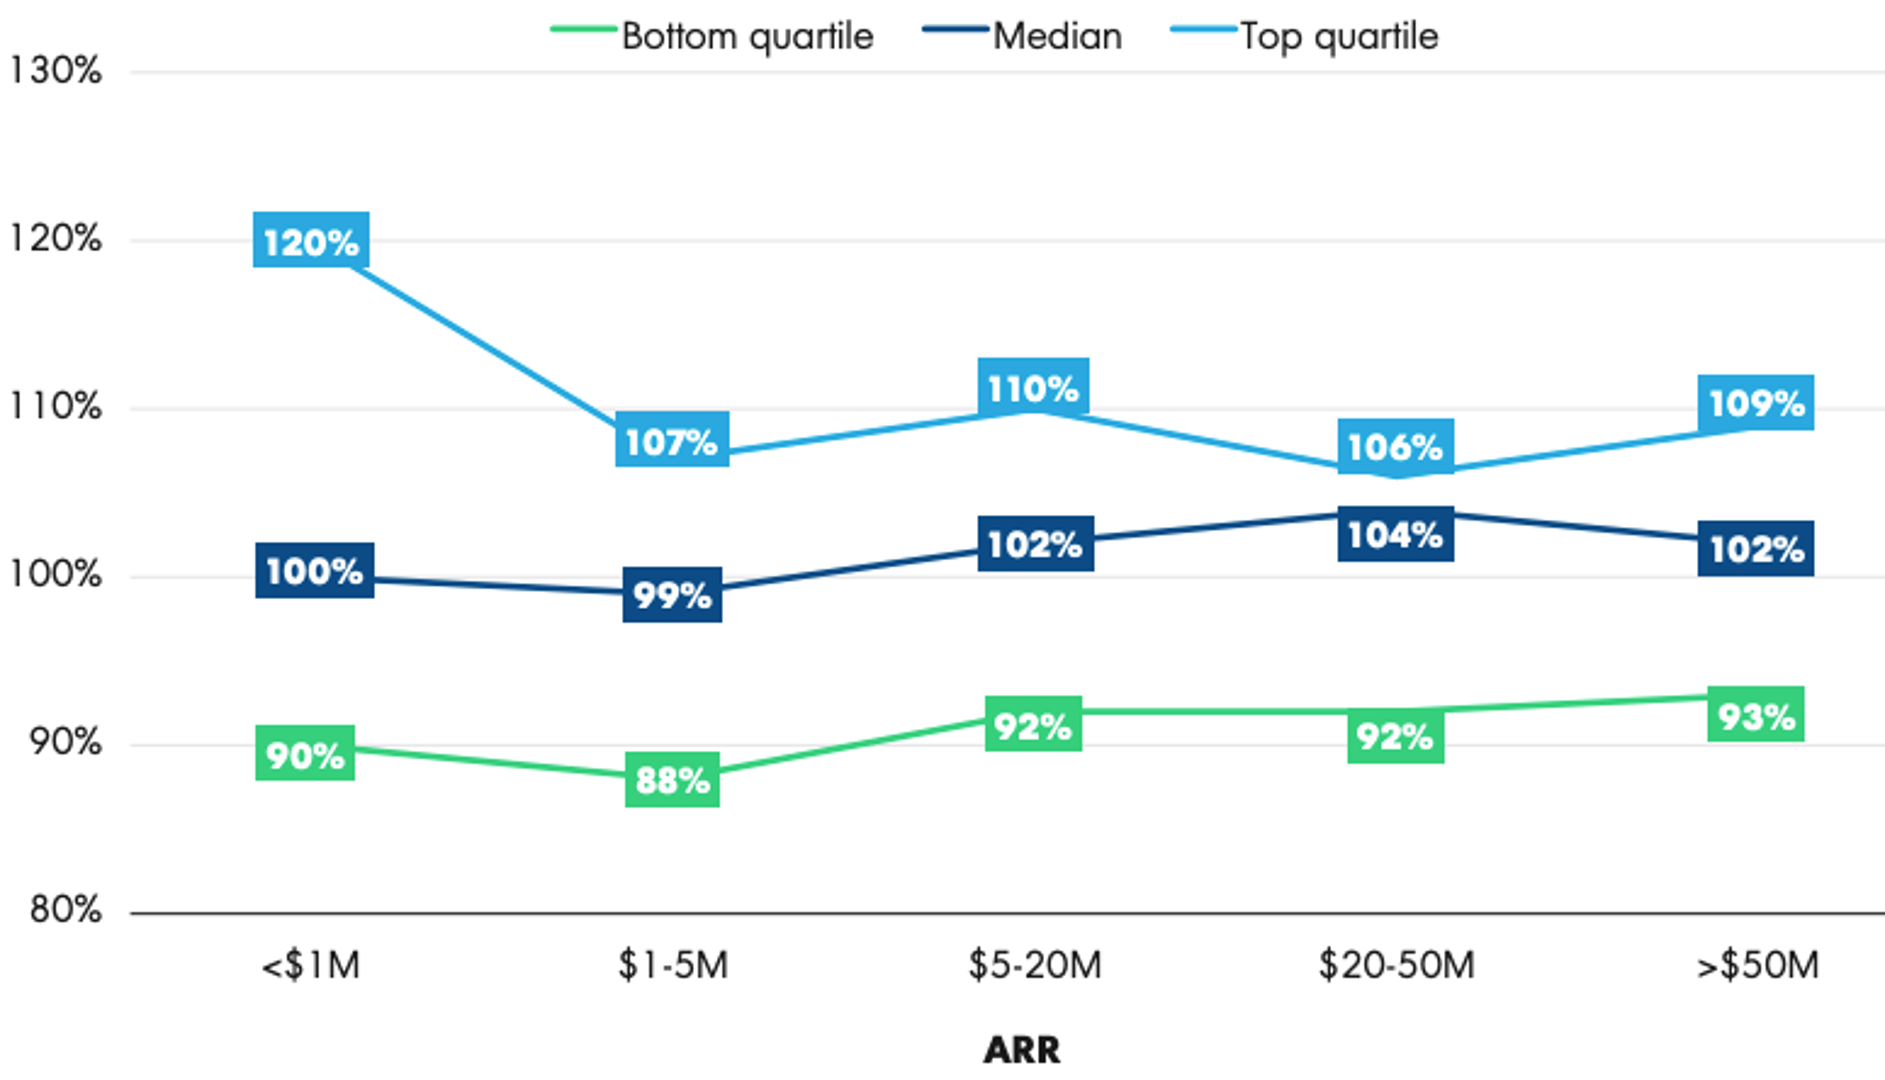
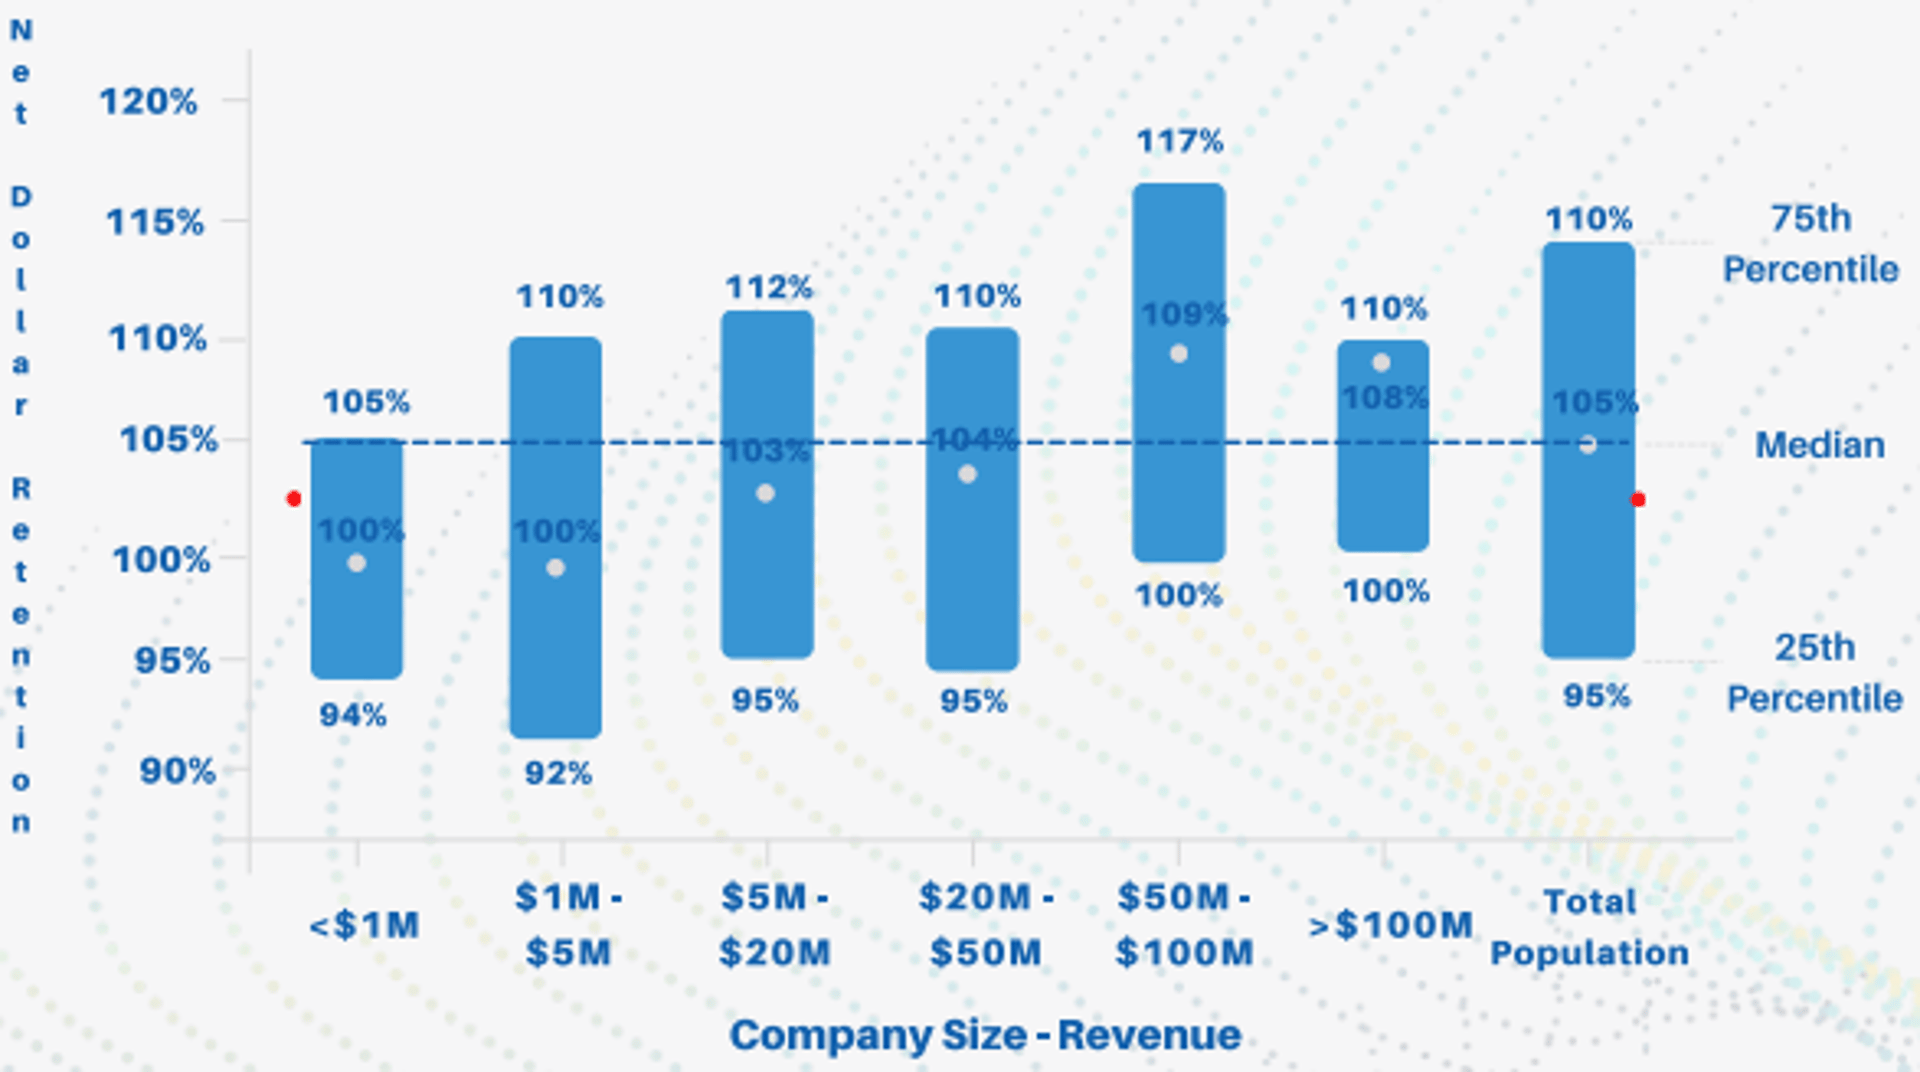
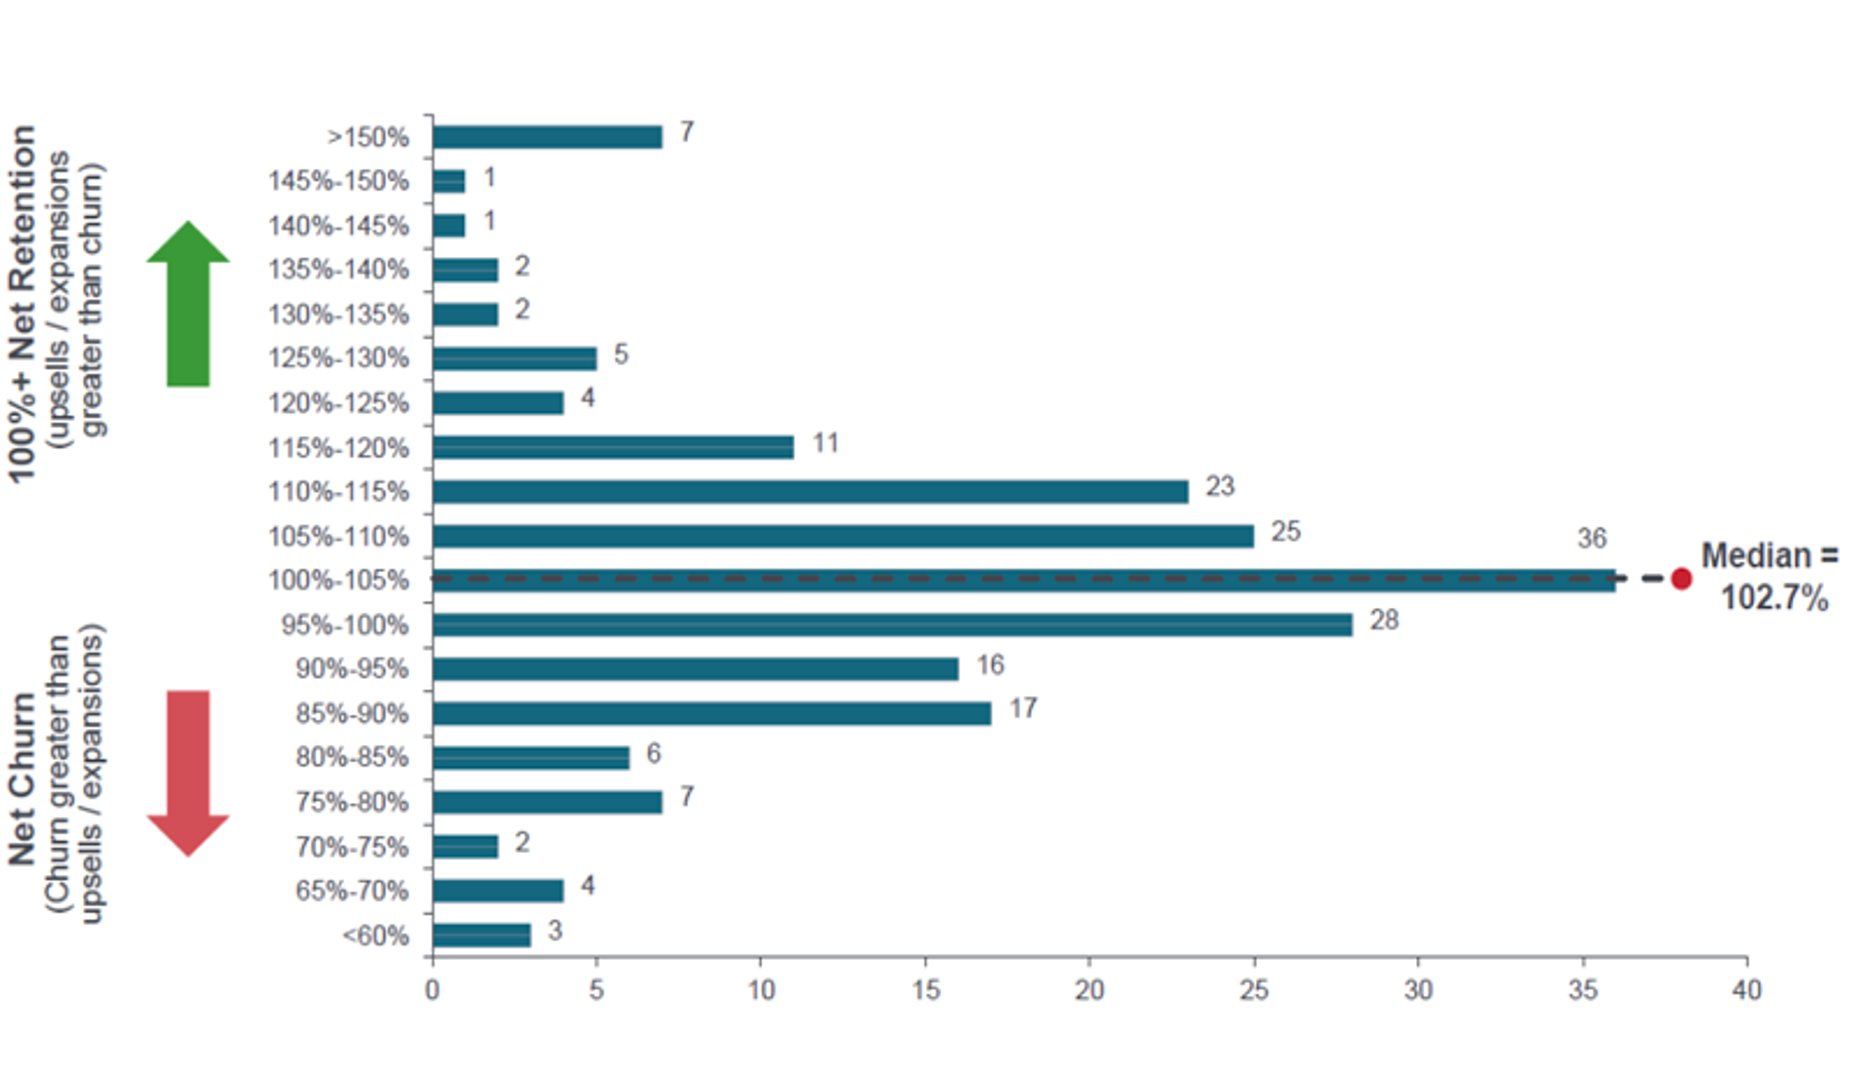
The most successful SaaS companies achieve negative Net MRR Churn Rates, meaning that expansions outweigh downgrades and cancellations. Best-in-class companies typically target monthly Net MRR Churn rates between -2% to -5% (equivalent to Net Revenue Retention rates of 102% to 105% monthly, or 125% to 180% annually). Early-stage companies should aim to reach break-even (0% Net MRR Churn) before focusing on negative churn. Companies with positive Net MRR Churn rates above 5% monthly may face sustainability challenges without strong new customer acquisition.
A line chart can help you optimally visualize your Net MRR Churn Rate data by letting you see how this metric trends over time. You can then adjust your strategy to meet your goals.
In contrast to Gross MRR Churn Rate, which looks only at downgrades and cancellations, Net MRR Churn Rate incorporates expansions, downgrades, and cancellations from the existing customer base. Net MRR Churn Rate is a critical KPI for subscription-based companies because the cost of retaining and growing existing customers is typically much lower than acquiring new ones. Additionally, existing customers represent predictable future revenue streams and often have higher lifetime values. The metric provides insight into whether a company can grow revenue from its current customer base without relying solely on new customer acquisition.
When interpreting Net MRR Churn Rate, consider it alongside customer segmentation analysis to understand which customer cohorts are driving expansion versus contraction. High-value enterprise customers may show different churn patterns compared to small business segments, and tracking this metric by customer tier reveals where to focus retention and expansion efforts. Companies should also monitor trends over time rather than focusing on single-month snapshots, as seasonal factors, product launches, or economic conditions can create temporary fluctuations.
For operational application, teams should establish clear thresholds for action: positive churn rates above 3-5% monthly may require immediate intervention through customer success initiatives, while consistently negative rates indicate opportunities to scale expansion strategies. The metric becomes particularly valuable when combined with leading indicators such as product usage metrics, support ticket volumes, and customer satisfaction scores, enabling proactive rather than reactive management.
Net MRR Churn Rate also serves as a key input for financial forecasting and growth planning. Companies with negative churn can model more aggressive growth scenarios, while those with positive churn need stronger new customer acquisition to maintain growth trajectories. The metric is calculated by taking the net change in MRR (downgrades and cancellations minus expansions) for the period and dividing by the total MRR at the start of the period.