If a florist has a revenue of $15,000 and Cost of Goods Sold is $6,000, their Gross Margin will be: ($15,000 - $6,000) / $15,000 = 60%
Gross Margin
Last updated: Jun 04, 2026
What is Gross Margin?
Gross Margin is a profitability ratio that measures Gross Profit as a percentage of total revenue. Typically, it is calculated as Gross Profit divided by Revenue. This metric is a key indicator of a company's financial health and operational efficiency.
Alternate names: Gross Profit Margin, MarkupGross Margin Formula
ƒ Sum(Gross Profit
Description: Gross Profit is the amount left over from total revenues after Cost of Goods Sold (COGS) has been deducted. COGS will typically include the cost of making and selling the product or the cost of services provided by the company.
) / Sum(RevenueDescription: Revenue is the total income generated from a company's primary business operations before deducting any costs or expenses. Often called the "top line" because it appears at the top of the income statement, revenue represents the gross amount earned from core business activities such as product sales, service fees, subscriptions, or licensing agreements.
)ƒ (Sum(Revenue
Description: Revenue is the total income generated from a company's primary business operations before deducting any costs or expenses. Often called the "top line" because it appears at the top of the income statement, revenue represents the gross amount earned from core business activities such as product sales, service fees, subscriptions, or licensing agreements.
) - Sum(Cost of Goods SoldDescription: The Cost Of Goods Sold (COGS) is the measure of direct costs incurred by a company to manufacture or deliver their product or service. Costs typically include raw material and direct labour, but this varies from business to business, depending on the products or services that are being sold. COGS is the building block to understanding Gross Margin and Gross Margin Percent.
)) / Sum(RevenueDescription: Revenue is the total income generated from a company's primary business operations before deducting any costs or expenses. Often called the "top line" because it appears at the top of the income statement, revenue represents the gross amount earned from core business activities such as product sales, service fees, subscriptions, or licensing agreements.
)How to calculate Gross Margin
Start tracking your Gross Margin data
Use PowerMetrics, modern analytics platform, to monitor your data. Choose a service below to start tracking your Gross Margin instantly.

What is a good Gross Margin benchmark?
For SaaS companies, Gross Margin is relatively consistent from smaller to larger companies, with median GM% between 69% and 76%, and the top quartile achieving 80% to 85%. Capchase 2022, n=439.
When looking at its portfolio of companies scaling to $10M in ARR, Bessemer Venture Partners reports the bottom quartile at less than 60%, the middle at 70%, and the top at 85% Gross Margin or higher. April 2022.
Expected ranges by industry: Software/Tech: 70-80% is typical Manufacturing: 25-40% is often considered healthy Retail: 25-35% is standard Services: 40-60% is common
Gross Margin benchmarks
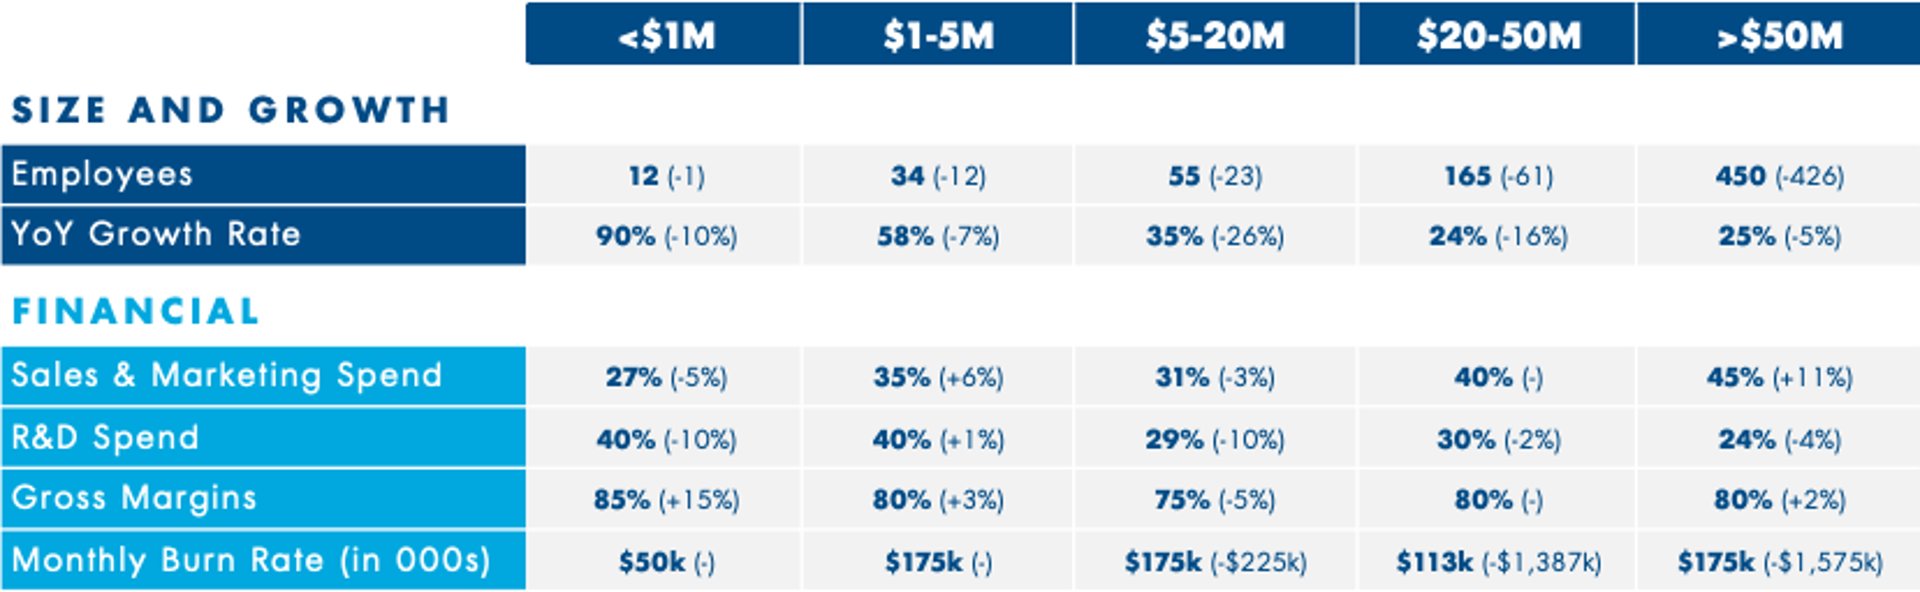
Financial Metrics by ARR (2023 vs 2022)

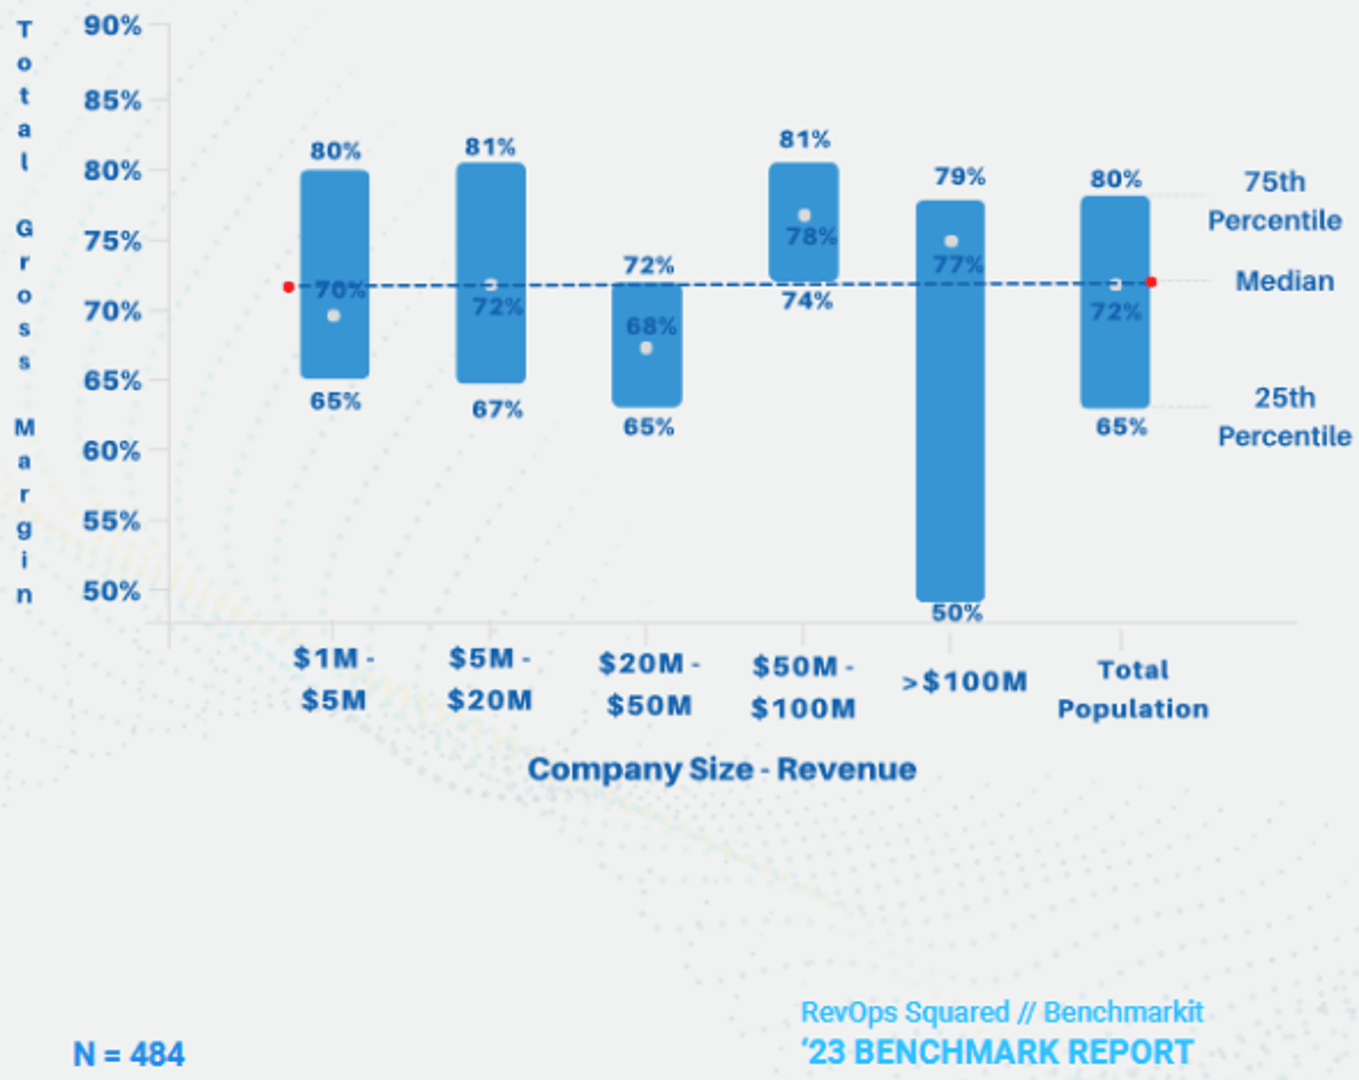
Gross Margin Percentage by Revenue

How to visualize Gross Margin?
Use a summary chart to visualize your Gross Margin data and compare it to a previous time period.
Gross Margin visualization example

Summary Chart
Here's an example of how to visualize your current Gross Margin data in comparison to a previous time period or date range.
Gross Margin
Chart
Measuring Gross MarginMore about Gross Margin
Gross Margin is the percentage of profit made by a company after the costs incurred in making a product are subtracted from the sales revenue. Gross Margin is typically expressed as a percentage, by dividing Gross Profit by Revenue.
Components of COGS (Cost of Goods Sold)
COGS encompasses all direct costs attributable to the production of goods sold or services delivered by a company. This includes the cost of materials, direct labor expenses, and direct factory or service delivery overheads. COGS explicitly excludes indirect expenses such as marketing, sales, R&D, and general administrative costs. The specific components vary by industry, but the fundamental principle remains: if a cost is directly tied to creating or delivering what you sell, it belongs in COGS.
COGS explicitly excludes operating expenses such as R&D/engineering (outside of direct service delivery), sales, marketing, and general administrative costs.
Financial Context
Gross Margin is a standard component of a company's income statement. Executives use it as an indication of how efficiently a company is using its resources and as a measure of pricing power. If labor and supply costs are high relative to revenue, then Gross Margin will be low. Usually, Gross Margin does not include fixed costs or costs that the company will incur regardless of output.
Analytical Considerations
Although Gross Profit may increase in absolute terms over time, Gross Margin percentage may remain stable or even decline. You need to look at both the absolute value (in dollars) and percentage value (by dividing Gross Profit by Revenue) for a true understanding of your metric. Since Gross Margin does not consider fixed costs, it does not provide a complete picture of profitability, which is why it must be tracked alongside other profitability metrics like Operating Margin and Net Margin.
Gross Margin trends often reveal more insight than absolute numbers alone. Declining gross margins may indicate increasing competition, pricing pressure, or rising input costs. Improving gross margins might suggest better economies of scale, increased operational efficiency, or successful premium pricing strategies.
Gross Margin Frequently Asked Questions
How should we interpret changes in our gross margin percentage over time?
Changes in gross margin tell a strategic story about your business. Declining margins might indicate pricing pressure from competitors, rising input costs you haven't offset, or a shift toward lower-margin products in your mix. Improving margins could signal increasing pricing power, operational efficiencies, or a shift toward higher-margin offerings.
The key is to decompose the change. For instance, a 3% drop might be driven by 2% higher materials costs, 1.5% from price concessions, offset by 0.5% improvement in manufacturing efficiency. This decomposition points to specific actions: perhaps renegotiating supplier contracts or selectively raising prices where competitive positioning allows.
For SaaS companies specifically, watch gross margins during rapid growth phases. Often, companies need to invest in customer success and infrastructure ahead of revenue, temporarily compressing margins before they expand again at scale.
Our sales team wants to discount heavily to win a large customer. How should we think about the gross margin impact?
This requires balancing short and long-term perspectives. Beyond the immediate margin impact, consider:
- Customer lifetime value: Will this customer expand significantly over time, justifying initial margin compression?
- Precedent setting: Will this discount establish expectations for future negotiations with other customers?
- Absorption effects: If you have high fixed costs in your COGS structure, additional volume can improve overall margins by spreading these costs across more units.
- Strategic positioning: Sometimes capturing a reference customer or entering a new market segment justifies a temporary margin sacrifice.
The most sophisticated approach is to model different scenarios of future growth with this customer against the margin sacrifice, then establish clear milestones for when margins should recover. Always document the strategic rationale for any significant margin exceptions to prevent normalized discounting.
How do our gross margins compare to industry benchmarks, and what's considered "good"?
Industry context is crucial here. While SaaS companies typically enjoy 70-85% gross margins, manufacturing might target 25-40%, and retail 30-50%. But even within industries, there's significant variation based on business model and positioning.
Rather than simple benchmarking, consider:
- Position in value chain: Companies closer to end customers generally command higher margins than those selling commoditized inputs.
- Value differentiation: Premium products with strong differentiation sustain higher margins than commodity offerings.
- Scale effects: Larger companies often achieve higher margins through operational efficiencies and purchasing power.
- Growth vs. profitability phase: Early-stage companies might accept lower margins to capture market share before expanding margins at scale.
The most valuable analysis isn't just comparing your margin to competitors, but understanding why differences exist and whether they reflect strategic choices or operational inefficiencies. A slightly lower margin might be perfectly acceptable if it's funding market share growth according to your strategic plan.
What are some common pitfalls when calculating COGS
- Misclassifying engineering costs as COGS when they're actually R&D
- Inconsistently allocating customer success teams (only those directly supporting the product belong in COGS)
- Overlooking amortization of capitalized software development costs which may belong in COGS
- Failing to separate variable costs from fixed costs