What is Gross Profit?
Gross Profit is the revenue remaining after subtracting the Cost of Goods Sold (COGS). It shows how efficiently a company produces and sells its goods or services, and how much revenue is available to cover operating costs and generate net income.
Gross Profit Formula
How to calculate Gross Profit
A beverage company generates $2 million in revenue in a fiscal year. Its COGS, covering ingredients, packaging, and production labour, totals $750,000. Gross Profit = $2,000,000 - $750,000 = $1,250,000. The company retains $1,250,000 to cover operating expenses, taxes, and profit.
Start tracking your Gross Profit data
Use PowerMetrics, modern analytics platform, to monitor your data. Choose a service below to start tracking your Gross Profit instantly.

What is a good Gross Profit benchmark?
Gross Profit benchmarks vary significantly by industry. Typical Gross Margin ranges (a percentage expression of Gross Profit) by sector, based on NYU Stern School of Business industry data (2024):
| Industry | Typical Gross Margin range | Notes |
|---|---|---|
| Software (SaaS) | 60%–80% | Low COGS; hosting and support are primary costs |
| Retail | 20%–50% | Highly variable by product category |
| Manufacturing | 25%–40% | Depends heavily on input costs and volume |
| Oil and gas | 15%–35% | Sensitive to commodity price swings |
| Professional services | 30%–60% | Labour-intensive; margin depends on billing rates |
Source: NYU Stern School of Business industry data, 2024.
How to visualize Gross Profit?
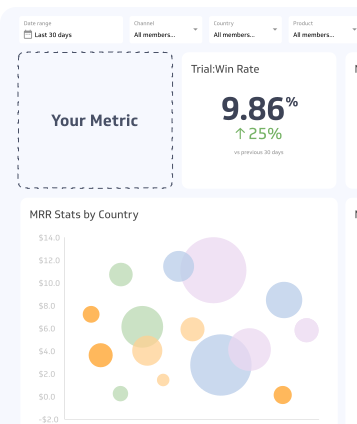
Use a summary chart to visualize your Gross Profit data and compare it to a previous time period.
Gross Profit visualization example

Summary Chart
Here's an example of how to visualize your current Gross Profit data in comparison to a previous time period or date range.
More about Gross Profit
How to interpret Gross Profit
Gross Profit is a monetary figure, not a ratio. A higher number means more revenue is available to cover operating costs and generate net income. A lower number signals that production or delivery costs are consuming too much of each dollar earned.
Because Gross Profit is an absolute value, it is most useful when tracked over time or compared against a consistent revenue base. A company growing Gross Profit quarter over quarter is generally improving its core economics, even if net income has not yet followed.
To compare across periods, business units, or competitors, pair Gross Profit with Gross Margin, which expresses the same relationship as a percentage of revenue.
What drives Gross Profit up or down
Several factors move Gross Profit in either direction.
Factors that increase Gross Profit:
-
Higher selling prices without a proportional increase in production costs
-
Lower input costs through supplier negotiations, volume discounts, or material substitutions
-
Improved production efficiency that reduces direct labour or waste per unit
-
Favourable product mix shifting sales toward higher-margin offerings
Factors that decrease Gross Profit:
-
Rising raw material or component costs not passed on to customers
-
Increased direct labour costs from wage growth or overtime
-
Supply chain disruptions that raise procurement costs
-
Pricing pressure from competition forcing discounts
Common pitfalls
Confusing COGS with operating expenses. COGS covers only direct production costs. Salaries for sales staff, marketing spend, and office rent belong in operating expenses. Misclassifying these inflates Gross Profit and distorts the picture of production efficiency.
Treating Gross Profit as the bottom line. Gross Profit does not account for operating expenses, interest, or taxes. A company can show strong Gross Profit while still running a net loss if overhead is high.
Ignoring product-level variation. An aggregate Gross Profit figure can mask wide differences across product lines or customer segments. Tracking Gross Profit by product or segment reveals where margin is actually being made or lost.
Overlooking volume effects. Gross Profit can grow in absolute terms while Gross Margin shrinks, if revenue is growing faster than efficiency gains. Track both figures together.
Related metrics
-
Gross Margin: Gross Profit expressed as a percentage of revenue. Use this for benchmarking and period-over-period comparison.
-
Revenue: The top-line figure from which COGS is subtracted to arrive at Gross Profit.
-
Net Profit: What remains after operating expenses, interest, and taxes are deducted from Gross Profit.
-
EBITDA: A measure of operating performance that sits below Gross Profit but above net income.
Gross Profit Frequently Asked Questions
What is Gross Profit?
Gross Profit is the revenue remaining after subtracting the Cost of Goods Sold (COGS). It shows how efficiently a company produces and sells its goods or services.
What is the formula for Gross Profit?
Gross Profit = Total Revenue - COGS. COGS includes direct costs tied to producing goods or delivering services, such as raw materials, direct labour, and manufacturing overhead.
What is the difference between Gross Profit and Gross Margin?
Gross Profit is an absolute dollar figure showing revenue remaining after COGS. Gross Margin expresses that same relationship as a percentage of revenue, making it more useful for benchmarking and period-over-period comparison.
What is the difference between Gross Profit and Net Profit?
Gross Profit is calculated before operating expenses, interest, and taxes. Net Profit is what remains after all of those costs are deducted. A company can have strong Gross Profit but still report a net loss if overhead is high.