Lifetime Value to Cost of Acquisition Ratio (LTV/CAC)
Last updated: Mar 21, 2024
What is Lifetime Value to Cost of Acquisition Ratio?
The Lifetime Value to Cost of Acquisition (LTV/CAC) Ratio tells you if the theoretical lifetime revenue you get from a customer is higher or lower than the sales and marketing costs needed to acquire that customer.
Lifetime Value to Cost of Acquisition Ratio Formula
Start tracking your Lifetime Value to Cost of Acquisition Ratio data
Build and track this metric in PowerMetrics, a modern analytics platform that lets you define metrics and connect your own data.
Get PowerMetrics Free
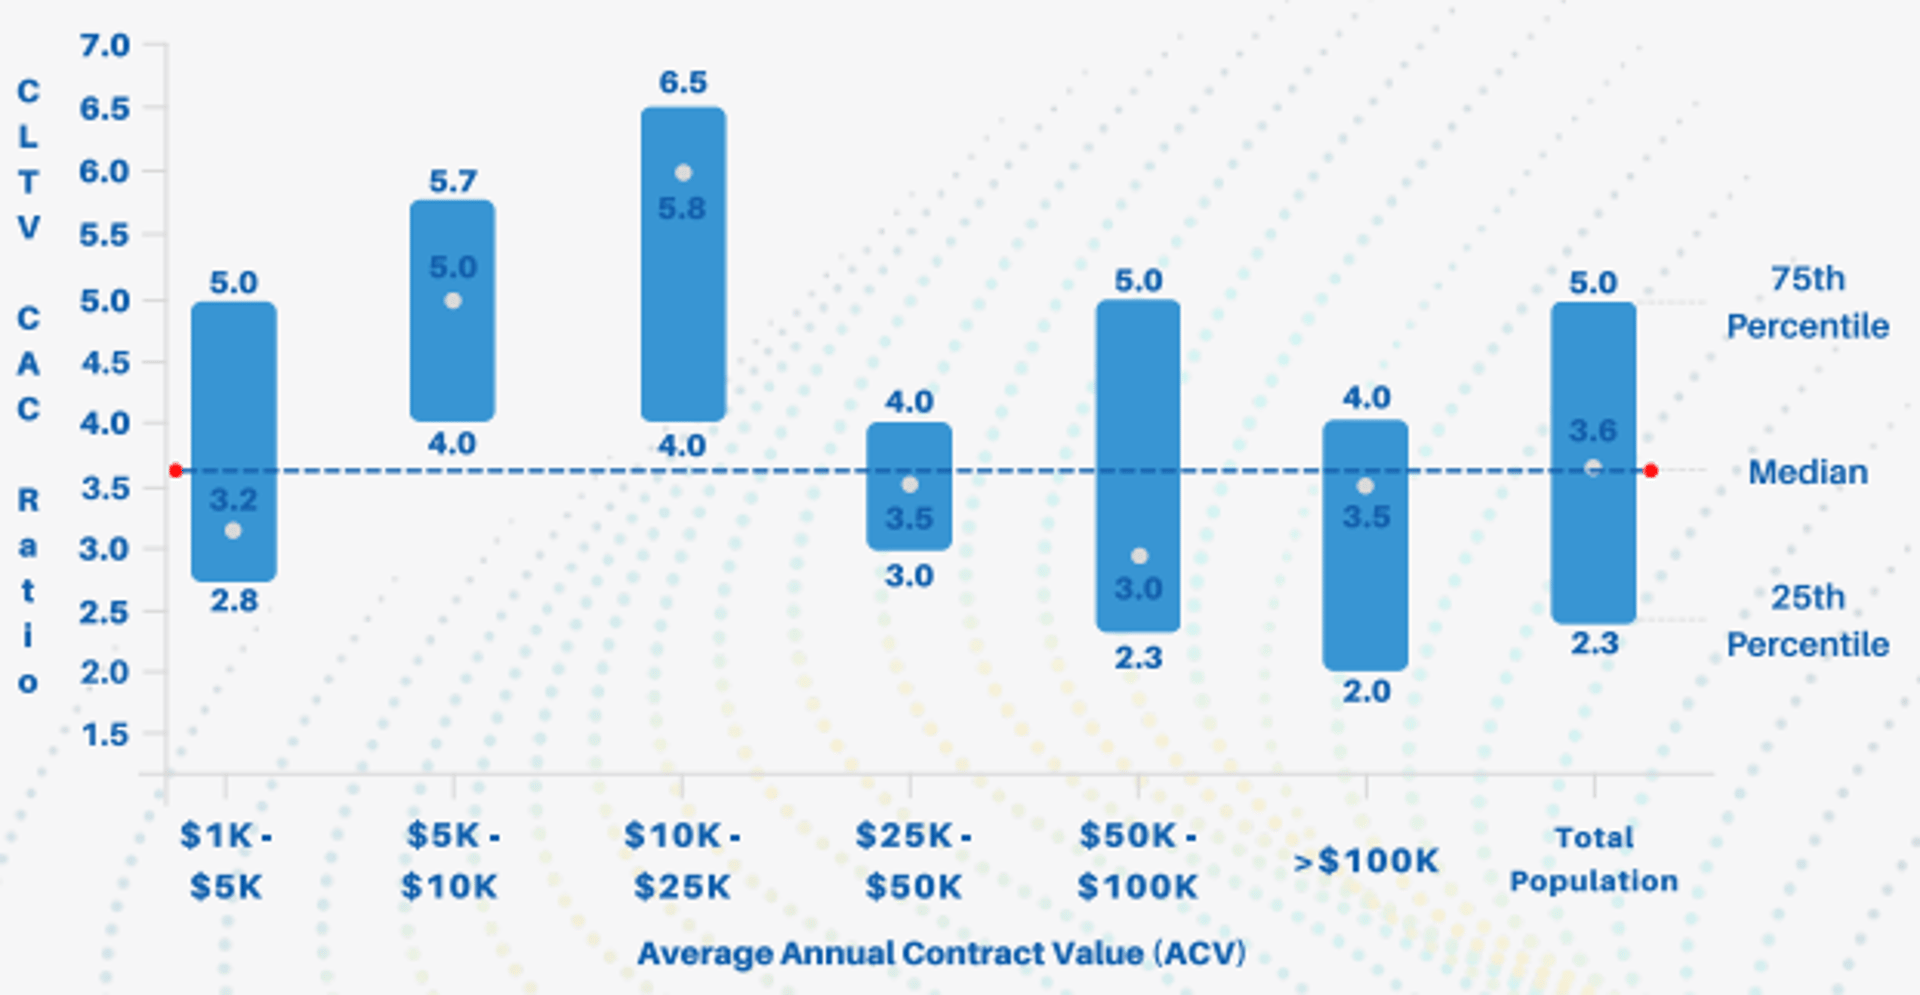
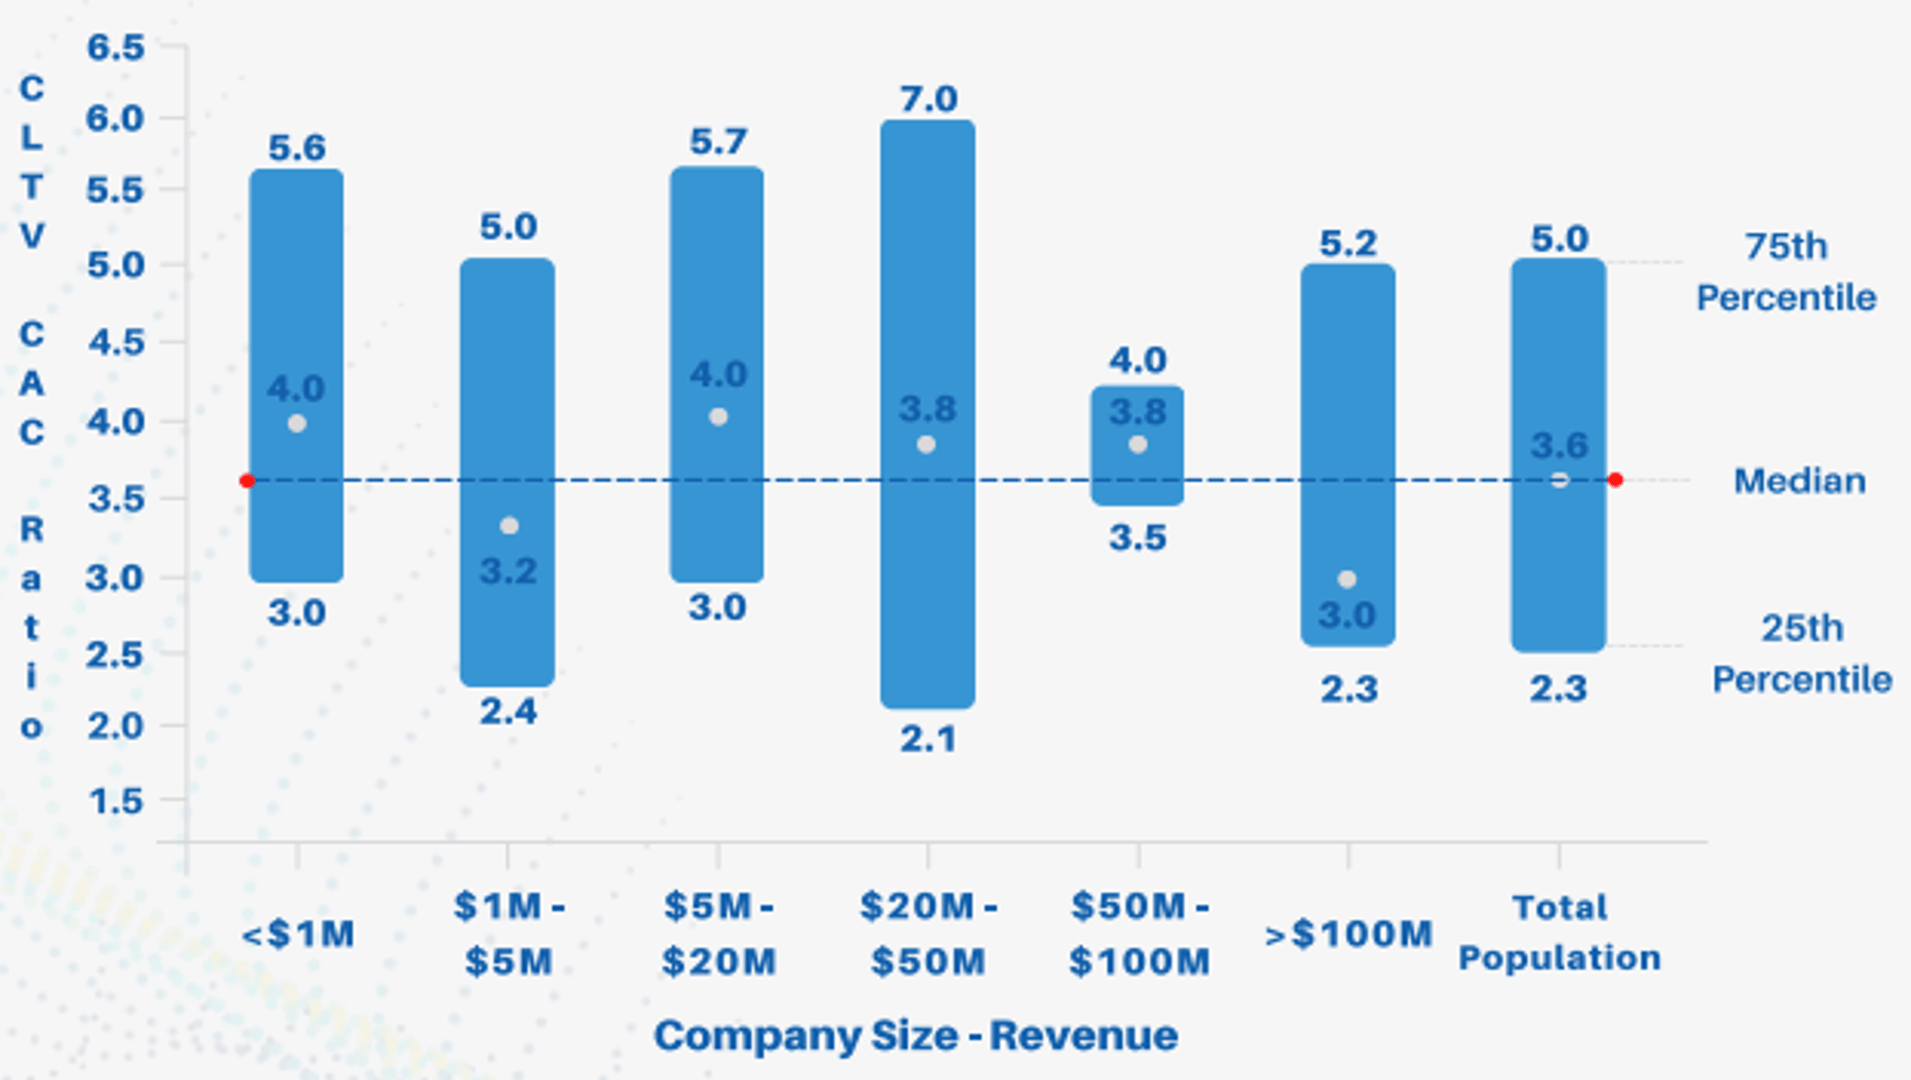
What is a good Lifetime Value to Cost of Acquisition Ratio benchmark?
For companies at 1-5M in ARR, the median LTV/CAC Ratio is between 3.4 and 4.2. For companies at 5-15M in ARR, the median LTV/CAC Ratio is between 4.6% and 6.2%. Capchase 2022, n=439. According to the Benchmarkit 2023 study, the benchmark for LTV:CAC has increased to a target range between 3.6 and 4.2.
Lifetime Value to Cost of Acquisition Ratio benchmarks


How to visualize Lifetime Value to Cost of Acquisition Ratio?
Ratios are usually expressed as single-digit numbers so it would be optimal to visualize Lifetime Value to Cost of Acquisition Ratio with a summary chart. Summary charts compare current values to a previous time period.
Lifetime Value to Cost of Acquisition Ratio visualization example

Summary Chart
Lifetime Value to Cost of Acquisition Ratio
Chart
Measuring Lifetime Value to Cost of Acquisition RatioMore about Lifetime Value to Cost of Acquisition Ratio
Customer Acquisition Cost is a direct reflection of the future success of your SaaS business. If you’re too cautious about your CAC, you could be missing out on customers and future revenue. Yet, if you spend too freely, you may be less profitable.
To scale your SaaS business, LTV/CAC ratio should be greater than 3. If it’s lower, continue working on your product market fit. If it's too high, above 5, invest more in marketing and sales. If this ratio is less than 1, you are losing money on each new customer.
You need to spend the right amount of CAC to drive new customers to your service without jeopardizing your LTV as well as the CAC Payback Period. The LTV/CAC ratio is an effective way of measuring this balance. Ensure you are calculating a fully burdened CAC that includes all acquisition costs, for example, implementation and support costs. Otherwise you risk over-inflating this metric.
Recommended resources related to Lifetime Value to Cost of Acquisition Ratio
Read more about Unit Economics and the LTV/CAC Ratio here.Contributor