What is Customer Conversion Rate?
Customer Conversion Rate is the percentage of contacts in your database that become paying customers. It shows how well your sales and marketing effort turns interest into revenue. Sales leaders, marketers, and founders use it to judge lead quality, sales effectiveness, and whether the funnel needs attention. A rising rate suggests your contacts fit your product and your sales process works. A falling rate points to weaker lead sources or slower follow-up.
Customer Conversion Rate Formula
How to calculate Customer Conversion Rate
Say your CRM holds 2,000 contacts that were added during the past year. By the end of the year, 200 of them have become paying customers.
- Count the won customers: 200.
- Count the contacts: 2,000.
- Divide 200 by 2,000 to get 0.10.
- Multiply by 100 to get 10%.
Your Customer Conversion Rate is 10%. For every 10 people who handed over their details, one became a customer.
Start tracking your Customer Conversion Rate data
Use PowerMetrics, modern analytics platform, to monitor your data. Choose a service below to start tracking your Customer Conversion Rate instantly.

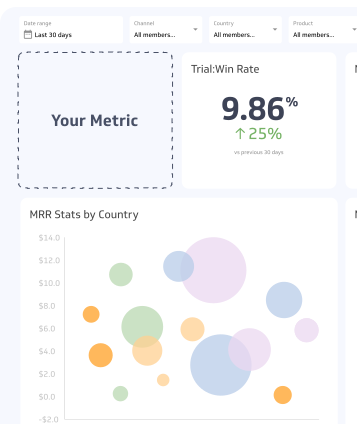
How to visualize Customer Conversion Rate?
You have a few options when visualizing Customer Conversion Rate. A simple summary chart can help you display your current Customer Conversion Rate in comparison to the past, while a bar chart can help you segment your data (by lead source, for example) and line charts can help you observe trends over time. Here are a few examples of how to visualize your Customer Conversion Rate:
Customer Conversion Rate visualization examples
Customer Conversion Rate

Bar Chart
Here's an example of how to visualize your Customer Conversion Rate data in a bar chart to observe segmented data.
Summary Chart
Here's an example of how to visualize your current Customer Conversion Rate data in comparison to a previous time period or date range.
Customer Conversion Rate
Pie Chart
Here's an example of how to visualize your Customer Conversion Rate data in a pie chart to identify the most prominent segment.
Customer Conversion Rate
Line Chart
Here's an example of how to visualize your Customer Conversion Rate data in a line chart over time.
More about Customer Conversion Rate
Application
How you use Customer Conversion Rate depends on your stage and sales model.
| Business type | How to use it |
|---|---|
| Early-stage company | Track one overall rate to learn whether any channel produces buyers at all. |
| Growing company with a sales team | Split the rate by lead source, rep, and region to find where conversion is strongest. |
| Ecommerce or subscription business | Track by acquisition campaign, since contacts often convert within days or weeks. |
| Long sales cycle (B2B, high-ticket) | Use cohorts, so contacts still in the pipeline are not counted as losses. |
Segment before you act
The overall rate hides more than it shows. Break it down by:
- Lead source: Which campaigns bring contacts that actually buy?
- Contact age: How long after signup do most contacts convert?
- Owner: Does conversion differ by rep or team?
- Segment: Does it vary by industry, company size, or plan?
Use the results to move budget and effort toward the sources and segments that convert, and to fix follow-up where they do not.
Common variations
The formula looks simple, but teams define the inputs differently. Choose one definition and document it.
Period-based vs cohort-based
A period-based rate divides customers won this month by contacts added this month. That is quick to calculate, but it mixes customers who were contacts months ago with new contacts who have not had time to convert. A cohort-based rate follows a fixed group of contacts and measures how many become customers over time. Cohorts are more accurate when sales cycles are long.
What counts as a contact
Some teams count every record in the CRM. Others count only qualified leads or marketing-engaged contacts. A broader definition lowers the rate without any change in performance. State which one you use.
What counts as a won customer
Most teams count a contact when a deal is closed-won or a first payment is made. Others require a renewal or a minimum spend. Pick one rule and apply it consistently.
Customer Conversion Rate vs other conversion rates
Customer Conversion Rate measures the whole journey from contact to customer. Other metrics measure a single step, such as lead-to-opportunity or visitor-to-signup conversion. The step-level rates explain why the overall rate moves; Customer Conversion Rate tells you the final outcome.
Leading vs lagging
Customer Conversion Rate is a lagging indicator. It reports what has already happened, and it can take weeks or months to settle when the sales cycle is long. To act sooner, watch earlier signals alongside it: response time to new contacts, the share of contacts that become qualified leads, and the number of sales meetings booked.
Best practices
- Keep the contact database clean. Remove duplicates, test records, and invalid emails. Otherwise the denominator is inflated and the rate looks worse than it is.
- Use consistent definitions. Document what counts as a contact and a won customer, and keep the rule fixed so trends mean something.
- Track by cohort when cycles are long. Group contacts by the month they were added and watch how each group converts over time.
- Review by source regularly. Check each lead source monthly or quarterly, and shift effort based on conversion, not volume alone.
- Pair it with revenue metrics. A channel with a lower conversion rate may still bring larger customers. Look at it next to Customer Acquisition Cost and customer value before cutting anything.
Common challenges
Inconsistent data entry
If reps update contact statuses late or differently, the rate shifts for reasons that have nothing to do with sales. Standardize stages and require status updates at fixed points.
Counting contacts that were never real prospects
Purchased lists, event scans, and bulk imports add contacts who never intended to buy. These drag the rate down. Track them as a separate source, or exclude them from the main calculation.
Chasing the rate instead of the outcome
A team can raise the rate by shrinking the denominator, for example by only adding contacts who are almost ready to buy. The percentage improves, but total customers may fall. Always track the count of won customers next to the rate.
Ignoring time lag
If you measure too soon, recent contacts have not had time to convert and the rate looks artificially low. Wait for at least one typical sales cycle before judging a campaign.
Comparing across different businesses
Rates from companies with different pricing, sales models, and contact definitions are not comparable. Use outside figures only when the contact and customer definitions match yours.
Related metrics
- Lead conversion rate: the share of leads that become customers, usually a narrower group than all contacts.
- Customer Acquisition Cost: what it costs to win each customer; it shows whether your conversion rate is affordable.
- Sales cycle length: how long conversion takes, which determines how you should time and cohort the measurement.
- Churn rate: what happens after conversion; a high conversion rate paired with high churn signals poor customer fit.
Customer Conversion Rate Frequently Asked Questions
How do you calculate Customer Conversion Rate?
Divide the number of won customers by the number of contacts, then multiply by 100. Use the same group of contacts and the same time period for both numbers.
What is a good Customer Conversion Rate?
It depends on your industry, price point, sales cycle, and how contacts were acquired. Compare your rate with your own past results and your own segments before looking at outside figures.
Why is my Customer Conversion Rate dropping?
Common causes are lower-quality lead sources, slower follow-up, a bloated contact database, or measuring contacts that have not had time to convert. Segment the rate by source and cohort to find which one applies.