A SaaS startup raises $5M in a seed round, $10M in a Series A, and $15M in a Series B. Total Funding = $5M + $10M + $15M = $30M. This figure represents all investor capital committed to date, not the amount remaining in the bank.
Total Funding
Last updated: Jul 15, 2026
What is Total Funding?
Total Funding is the cumulative amount of external capital a company has raised across all financing rounds, from seed through late-stage investment.
Total Funding Formula
ƒ Sum of all funding rounds raised to date
How to calculate Total Funding
Start tracking your Total Funding data
Build and track this metric in PowerMetrics, a modern analytics platform that lets you define metrics and connect your own data.
Get PowerMetrics Free
What is a good Total Funding benchmark?
Global venture funding reached $425 billion across over 24,000 deals in 2025, according to Crunchbase. U.S. startups secured the largest portion of this, capturing about 64% of the global total.
The 2025 venture market was highly competitive and top-heavy. Here are key numbers from both firms:
Global Funding
- Total Deployed: PitchBook reports that $512.6 billion was invested worldwide. Crunchbase tracked $425 billion deployed across more than 24,000 companies.
- The AI Boom: Artificial Intelligence dominated the market. Crunchbase data shows AI companies raised $211 billion, which is nearly half of all global venture funding.
U.S. Funding
- Total Deployed: U.S. companies captured the vast majority of capital, with Crunchbase tracking $274 billion in the U.S. market. PitchBook noted U.S. deal values alone hit $339.4 billion.
- Capital Concentration: Funding became highly centralized. Crunchbase reports that a massive 40% of U.S. venture capital went to just 10 companies, most of which are building large AI models.
Total Funding benchmarks
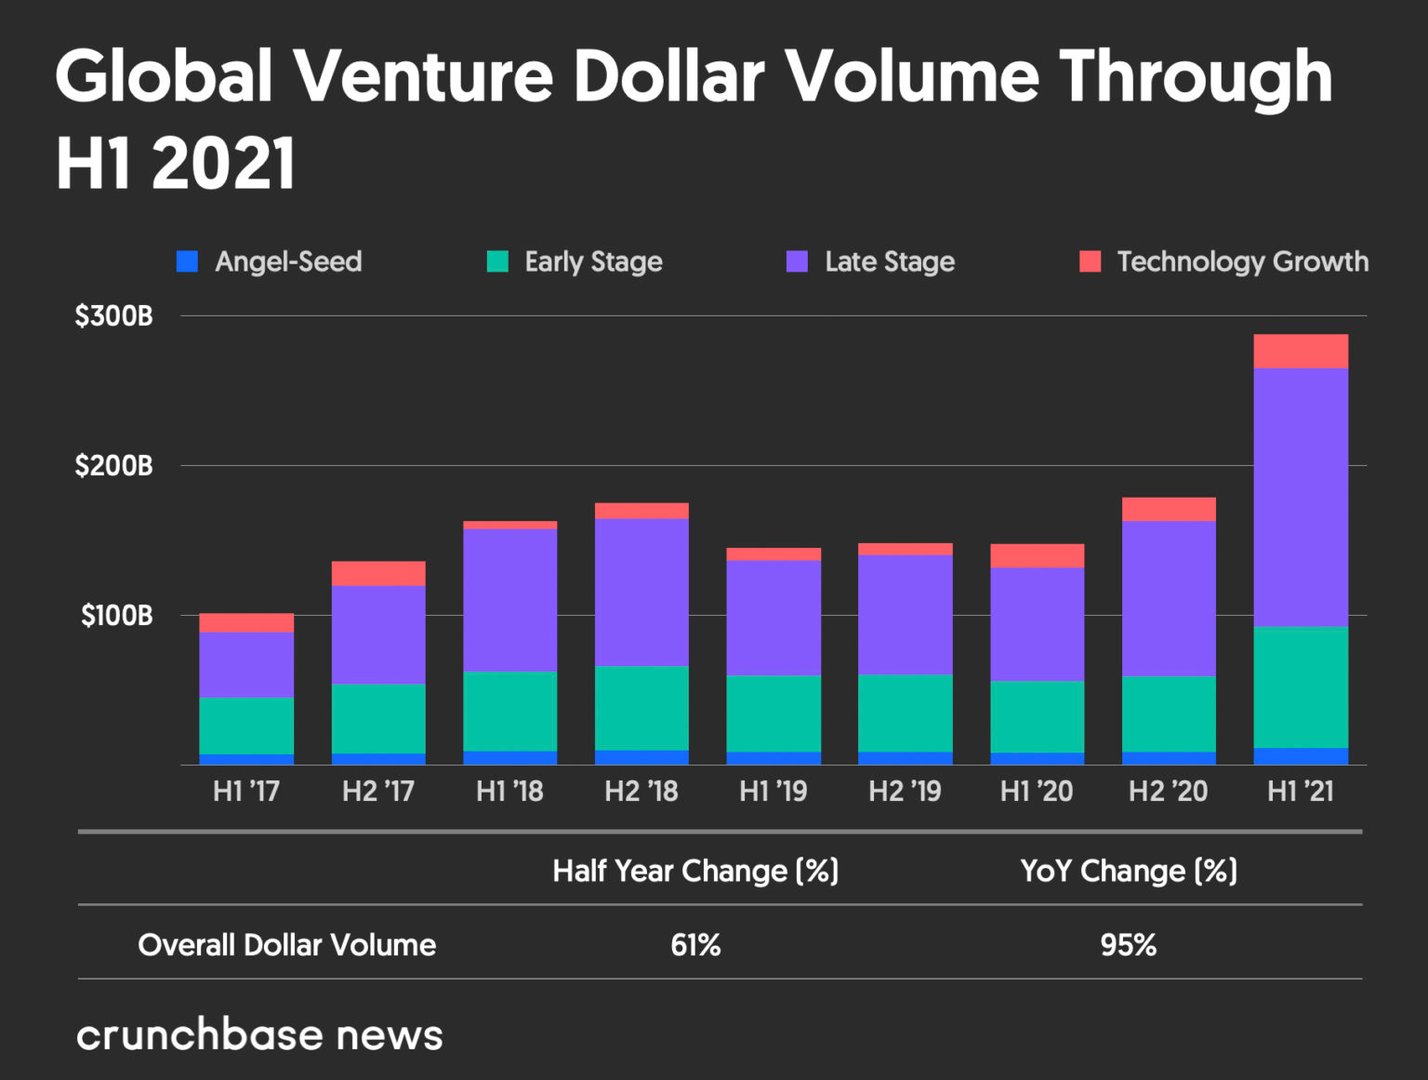
Global Venture Dollar Volume 2021

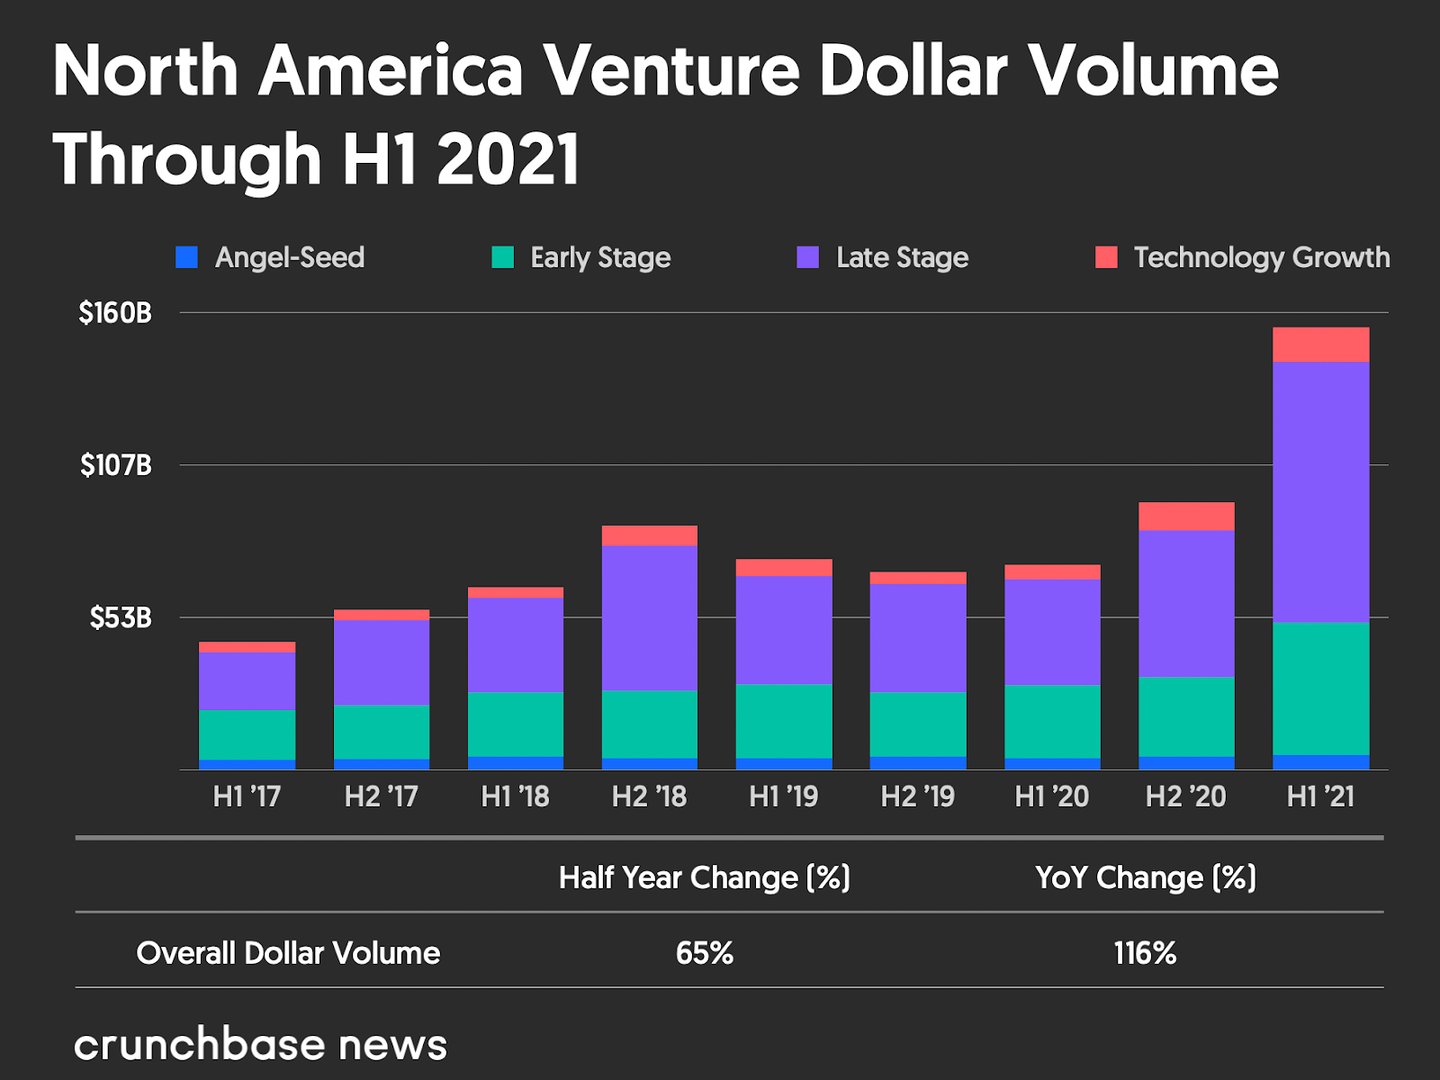
North American Venture Dollar Volume 2021


How to visualize Total Funding?
Use a bar chart to segment your total funding by year. Alternatively, you can also view your overall funding numbers with a summary chart. Take a look at the examples:
Total Funding visualization examples

Summary Chart
Here's an example of how to visualize your current Total Funding data in comparison to a previous time period or date range.
Total Funding
Bar Chart
Here's an example of how to visualize your Total Funding data in a bar chart to observe segmented data.
Total Funding
Chart
Measuring Total FundingMore about Total Funding
What is Total Funding?
Total Funding is the sum of all external capital a company has raised, from seed through late-stage rounds. It includes venture capital, angel investment, corporate investment, and any other equity or convertible financing. It does not include debt financing such as venture debt unless that debt converts to equity.
Why Total Funding matters
Total Funding is a signal of investor confidence, growth stage, and market positioning. It tells founders, operators, and investors how much capital has been committed to a company's vision.
Internally, it anchors financial planning. Knowing total capital raised helps leadership benchmark spending against what the market has funded, assess runway, and make informed decisions about when to raise again.
Externally, Total Funding is a widely cited benchmark for comparing companies within a sector. It appears in competitive analyses, investor decks, and press releases as a proxy for scale and momentum.
That said, Total Funding alone is incomplete. A company that has raised $50M and spent it inefficiently is in a weaker position than one that raised $20M and deployed it well. Always read Total Funding alongside efficiency and burn metrics.
How to use Total Funding effectively
Pair Total Funding with the following metrics to get a complete picture of capital health:
- Net Burn: How much cash the company is consuming each month. High Total Funding with high burn signals short runway.
- Burn Multiple: Net burn divided by net new ARR. Measures how much capital it costs to generate each dollar of new revenue.
- Bessemer Efficiency Score: Net new ARR divided by net burn. Tracks how efficiently capital converts to growth.
Together, these metrics answer the question investors and boards ask most: are we spending our funding wisely?
Tracking Total Funding over time
Update Total Funding each time a new round closes. Track it as a running total, not just the most recent round. This gives a clear view of cumulative investor commitment and helps contextualize spending decisions at each stage.
For early-stage companies, Total Funding often sets the ceiling for operating expenses until the next round. For later-stage companies, it reflects the full scale of capital deployed and the expectations that come with it.
Common pitfalls
Confusing Total Funding with cash on hand. Total Funding reflects what has been raised, not what remains. A company that raised $30M two years ago may have $3M left. Always check cash balance and burn rate separately.
Including venture debt without qualification. Some companies include venture debt in their Total Funding figure. This inflates the number and can mislead stakeholders. Be explicit about what is and is not included in your definition.
Using Total Funding as a success metric. Raising capital is a means, not an end. High Total Funding with low revenue growth or poor unit economics is a warning sign, not a badge of honour.
Contributor