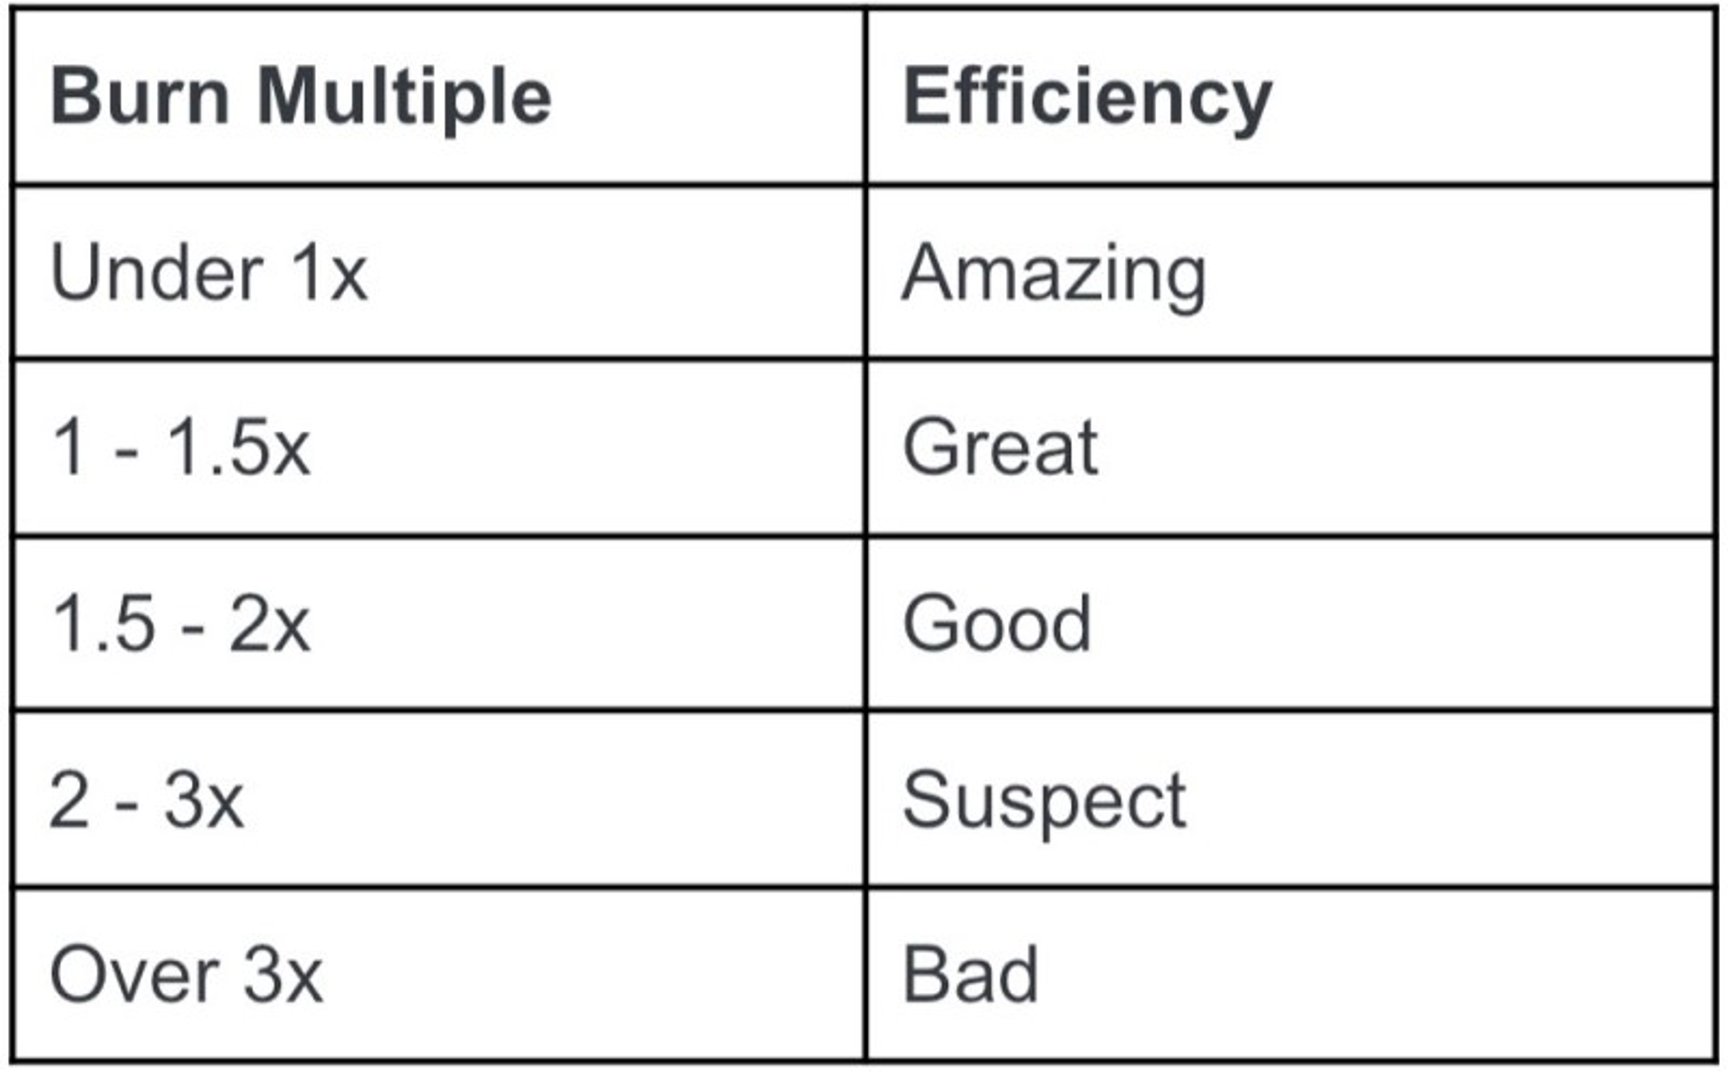
Burn Multiple

Date created: Oct 12, 2022  •   Last updated: Mar 21, 2024

What is Burn Multiple

Burn Multiple measures how much a startup is burning in order to generate each incremental dollar of ARR. This metric evaluates burn as a multiple of revenue growth. The higher the Burn Multiple, the more the startup is burning to achieve each unit of growth. The lower the Burn Multiple, the more efficient the growth is.

Burn Multiple Formula

How to calculate Burn Multiple

Q1 just ended and it’s time for a board meeting. The startup reports that it burned $2M in the quarter while adding $1M to its ARR. That’s a 2x Burn Multiple — reasonable for an early-stage startup. On the other hand, if the company burned $5M in Q1 to add $1M of net new ARR, that’s a terrible Burn Multiple (5x). It should probably cut costs immediately. That company is spending like a later-stage company without delivering later-stage growth.

Start tracking your Burn Multiple data

Use Klipfolio PowerMetrics, our free analytics tool, to monitor your data.

Get PowerMetrics Free
Klipfolio dashboard image

What is a good Burn Multiple benchmark?

For SaaS companies at 1-3M in ARR, the median Burn Multiple is between 1.7x. At 3-5M in ARR, the multiple drops to 1.0x, at 5-10M in ARR it hits 0.65x, and then reaches 0.85x for companies at 10-15M in ARR. Capchase 2022, n=439.

Burn Multiple benchmarks

Burn Multiple Efficiency Rating

klipfolio imageklipfolio image
Craft Ventures

Monthly Burn Rate by Revenue

klipfolio imageklipfolio image
Benchmarkit, 2023
arrow-right icon
arrow-right icon

How to visualize Burn Multiple?

A summary chart is the best way to visualize Burn Multiple. Summary Charts display the current value in comparison with the past. Take a look at the example:

Burn Multiple visualization example

Burn Multiple

2x

arrow-right icon

0.53

vs previous period

Summary Chart

Here's an example of how to visualize your current Burn Multiple data in comparison to a previous time period or date range.
arrow-right icon
arrow-right icon

Burn Multiple

Chart

Measuring Burn Multiple

More about Burn Multiple

Venture Capitals use the Burn Multiple to help assess the quality of product-market fit. The startup that generates $1M million in ARR by burning $2M is more impressive than one that does it by burning $5M. In the former case, it appears that the market is pulling product out of the startup, whereas in the latter case, the startup is pushing its product onto the market.

The beauty of the Burn Multiple is that it’s a catch-all metric. Any serious problem will eventually impact the Burn Multiple by either increasing burn, decreasing net new ARR, or increasing both but at disproportionate rates.

If the startup is pre-revenue, net new ARR will be zero so the ratio will not even compute. The founders should focus on keeping burn low and crossing the Penny Gap, in other words getting their first few paying customers, as quickly as possible. The Burn Multiple should improve as the startup matures. Eventually, for a company to become profitable, burn must reach 0, which implies that the Burn Multiple should also approach 0 over time.

Recommended resources related to Burn Multiple

Read about Burn Multiple from David Sacks.

Metric Toolkit