Say your SaaS app has 20,000 monthly active users. You define users who invite team members, complete onboarding tasks, and view reports on any given day as daily active users. Based on this definition, you have 5,000 DAUs which gives you a DAU/MAU Ratio of 5,000 / 20,000 or 25%.
DAU/MAU Ratio
Last updated: Jun 04, 2026
What is DAU/MAU Ratio?
DAU/MAU Ratio (Daily Active Users to Monthly Active Users ratio) measures how active monthly users are on a daily basis. In other words, this engagement metric measures the number of days in each month that users performed an activity that qualifies them as active users. A higher DAU/MAU Ratio generally indicates high stickiness, meaning users consistently return to the app.
Alternate names: Daily Active Users to Monthly Active Users RatioDAU/MAU Ratio Formula
ƒ Count(DAU
Description: Daily Active Users (DAU) is the count of unique users who interact with an application or platform on a given day. DAU measures daily engagement and includes both new and returning users. Unique users are identified by a username, email address, or user ID, and active users can be paying or non-paying.
) / Count(MAUDescription: Monthly Active Users (MAU) is the count of unique users who interact with an application or platform at least once in a given month. MAU tracks engagement across both new and returning users, and serves as an early indicator of retention risk or growth momentum. Unique users are identified by username, email address, or user ID. Both paying and non-paying users count, including those on free trials.
)How to calculate DAU/MAU Ratio
Start tracking your DAU/MAU Ratio data
Use PowerMetrics, modern analytics platform, to monitor your data. Choose a service below to start tracking your DAU/MAU Ratio instantly.


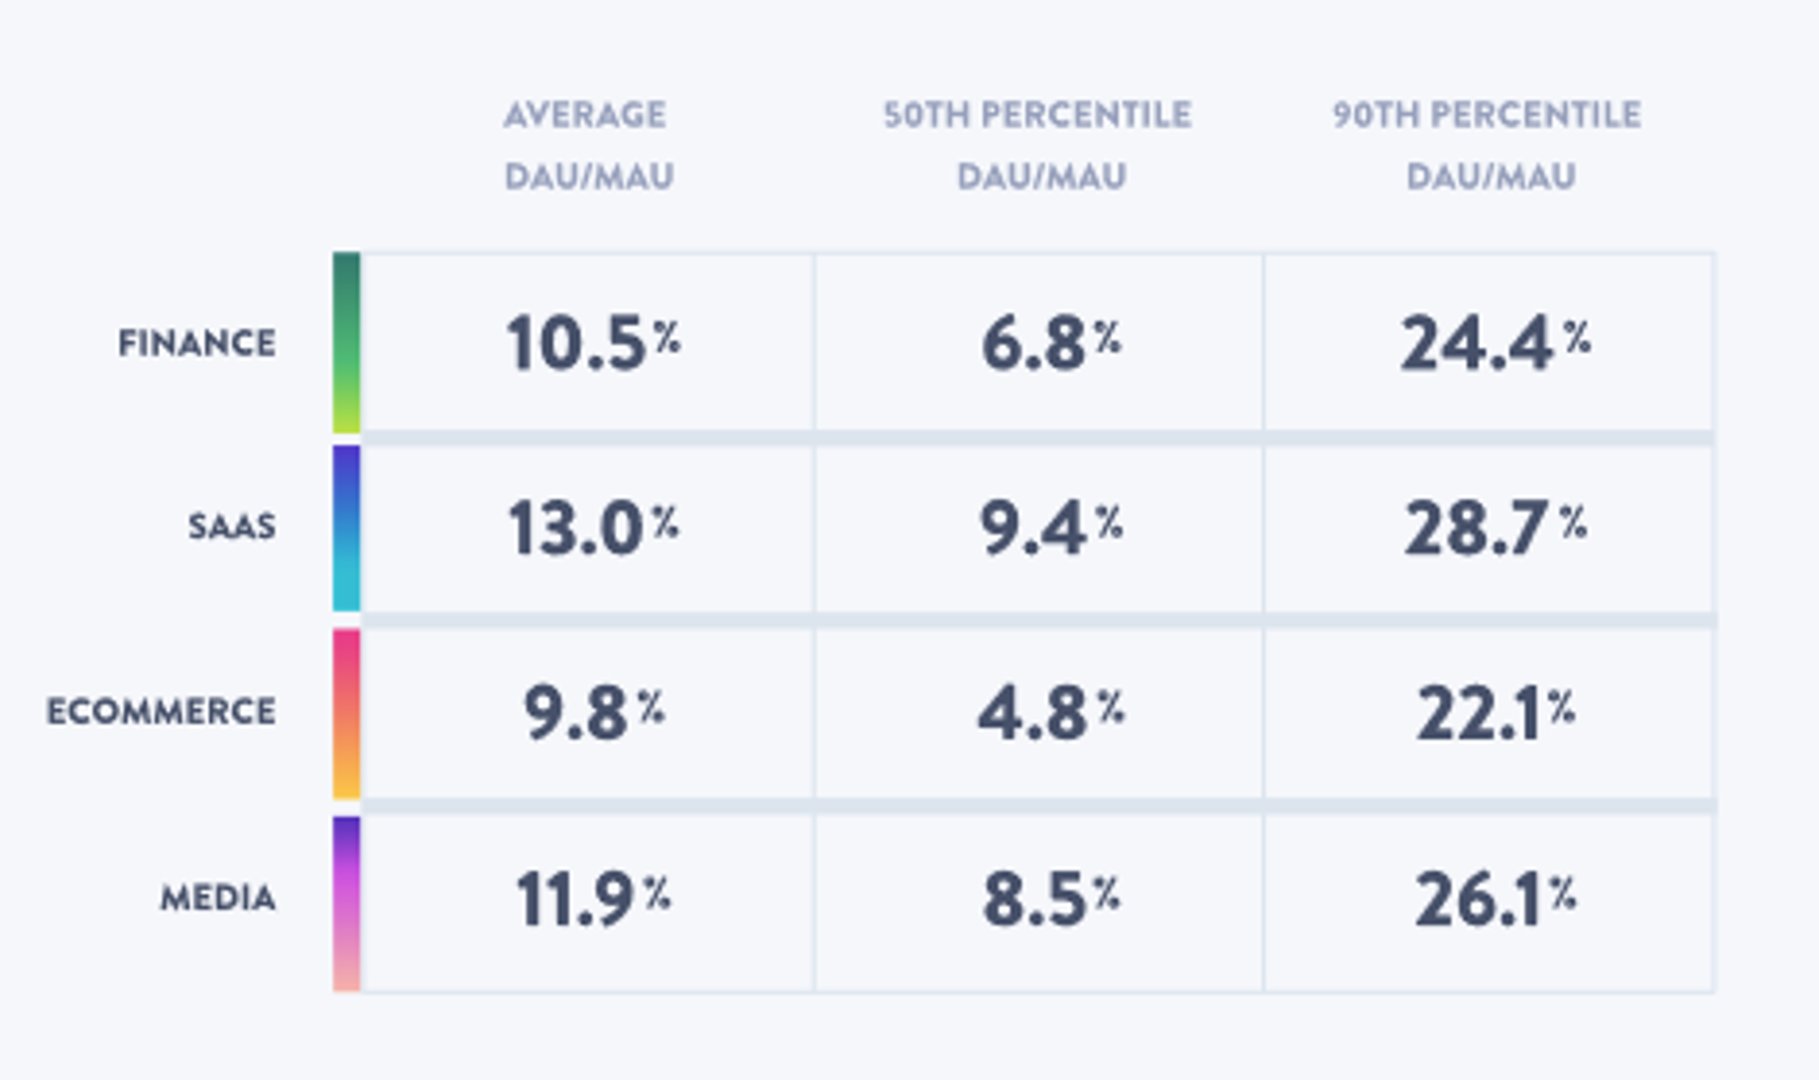
What is a good DAU/MAU Ratio benchmark?
According to Mixpanel's product benchmark report, the average DAU/MAU Ratio benchmark for SaaS B2B and B2C apps is 13%. B2C apps, especially social apps, have a higher DAU/MAU Ratio of around 20% - 50%, while the range is much lower for B2B.
DAU/MAU Ratio benchmarks

How to visualize DAU/MAU Ratio?
The DAU/MAU Ratio does include daily active users in the calculation, however it is usually tracked on a monthly basis. This is because you need to wait for the entire month's MAU count to get the most accurate reflection of DAU/MAU. Take a look at the example charts to learn two possible ways you can track and visualize your DAU/MAU Ratio data:
DAU/MAU Ratio visualization examples
DAU/MAU Ratio

Line Chart
Here's an example of how to visualize your DAU/MAU Ratio data in a line chart over time.
Summary Chart
Here's an example of how to visualize your current DAU/MAU Ratio data in comparison to a previous time period or date range.
DAU/MAU Ratio
Chart
Measuring DAU/MAU RatioMore about DAU/MAU Ratio
The number of Active Users who interact with an application can be tracked on a daily, weekly, and monthly basis. The number of Active Users who interact with an application daily are known as Daily Active Users (DAU). Similarly, the number of Active Users each month is known as Monthly Active Users (MAU). To calculate the DAU/MAU ratio, divide DAU by MAU.
Popularized by Facebook, the DAU/MAU ratio is a key indicator of continued engagement with an application, also known as stickiness. The significance of tracking the DAU/MAU ratio, as opposed to the DAU or MAU individually, arises from the fact that the ratio measures growth alongside stickiness. When the DAU and MAU metrics are combined, they tell the story of an application’s growing customer base alongside the ability of the application to engage users more frequently.
The closer to 100% the DAU/MAU ratio is, the better the engagement and stickiness of the application.
DAU/MAU Ratio Frequently Asked Questions
How is DAU calculated?
DAU, or Daily Active Users, is calculated by counting the unique number of daily users who are tagged as "active" in your product. You can also calculate the average DAU by dividing the total DAU for the month by the number of days in the month.
What is DAU MAU WAU?
DAU MAU WAU refers to Daily, Monthly, and Weekly Active Users. Each of these activation metrics help you analyze app performance and stickiness in different contexts and time periods. Read more:
- Daily Active Users definition
- Monthly Active Users definition
- Weekly Active Users definition
Can DAU be higher than MAU?
No, DAU cannot be higher than MAU because MAU is the count of Daily Active Users in any given month or rolling 30-day window. Even if you calculate an average DAU (Daily Active Users by the number of days in the month) or average MAU (Monthly Active Users by the number of months in the year), DAU is still a building block of MAU and so will always be lower than MAU.
The DAU/MAU Ratio often measures stickiness and you'd have a ratio higher than 1 if DAU could be higher, which does not make sense when measuring how sticky a product is.
How do I start tracking DAU and MAU?
Often, analytics platforms such as Google Analytics and Mixpanel automatically calculate and track Daily Active Users and Monthly Active Users data for you. You can also use free tools such as Klipfolio PowerMetrics to pull your DAU/MAU data from multiple sources into one place for further analysis.
Recommended resources related to DAU/MAU Ratio
A good article on DAU/MAU by Andrew Chen, investor in consumer startups.Contributor

