Revenue per Employee (RPE)
Last updated: Apr 28, 2025
What is Revenue per Employee?
Revenue per Employee is a measure of the total Revenue for the last twelve months (LTM) divided by the current number of Full-Time Equivalent employees. Also known as Revenue to Employee Ratio, this ratio is among the most universally applicable and is often used to compare companies within the same industry.
Revenue per Employee Formula
How to calculate Revenue per Employee
If a company employs 50 people and has a revenue of $7.5M annually, their Revenue per Employee ratio is $150,000 on an annual basis. If they begin working on a new product line and hire an additional 25 employees, based on the same revenue, their Revenue per Employee ratio will be $100,000 annually.
Explore Revenue per Employee sample data
This visualization is a live embed from Klipfolio PowerMetrics.
Start tracking your Revenue per Employee data
Use PowerMetrics, modern analytics platform, to monitor your data. Choose a service below to start tracking your Revenue per Employee instantly.

What is a good Revenue per Employee benchmark?
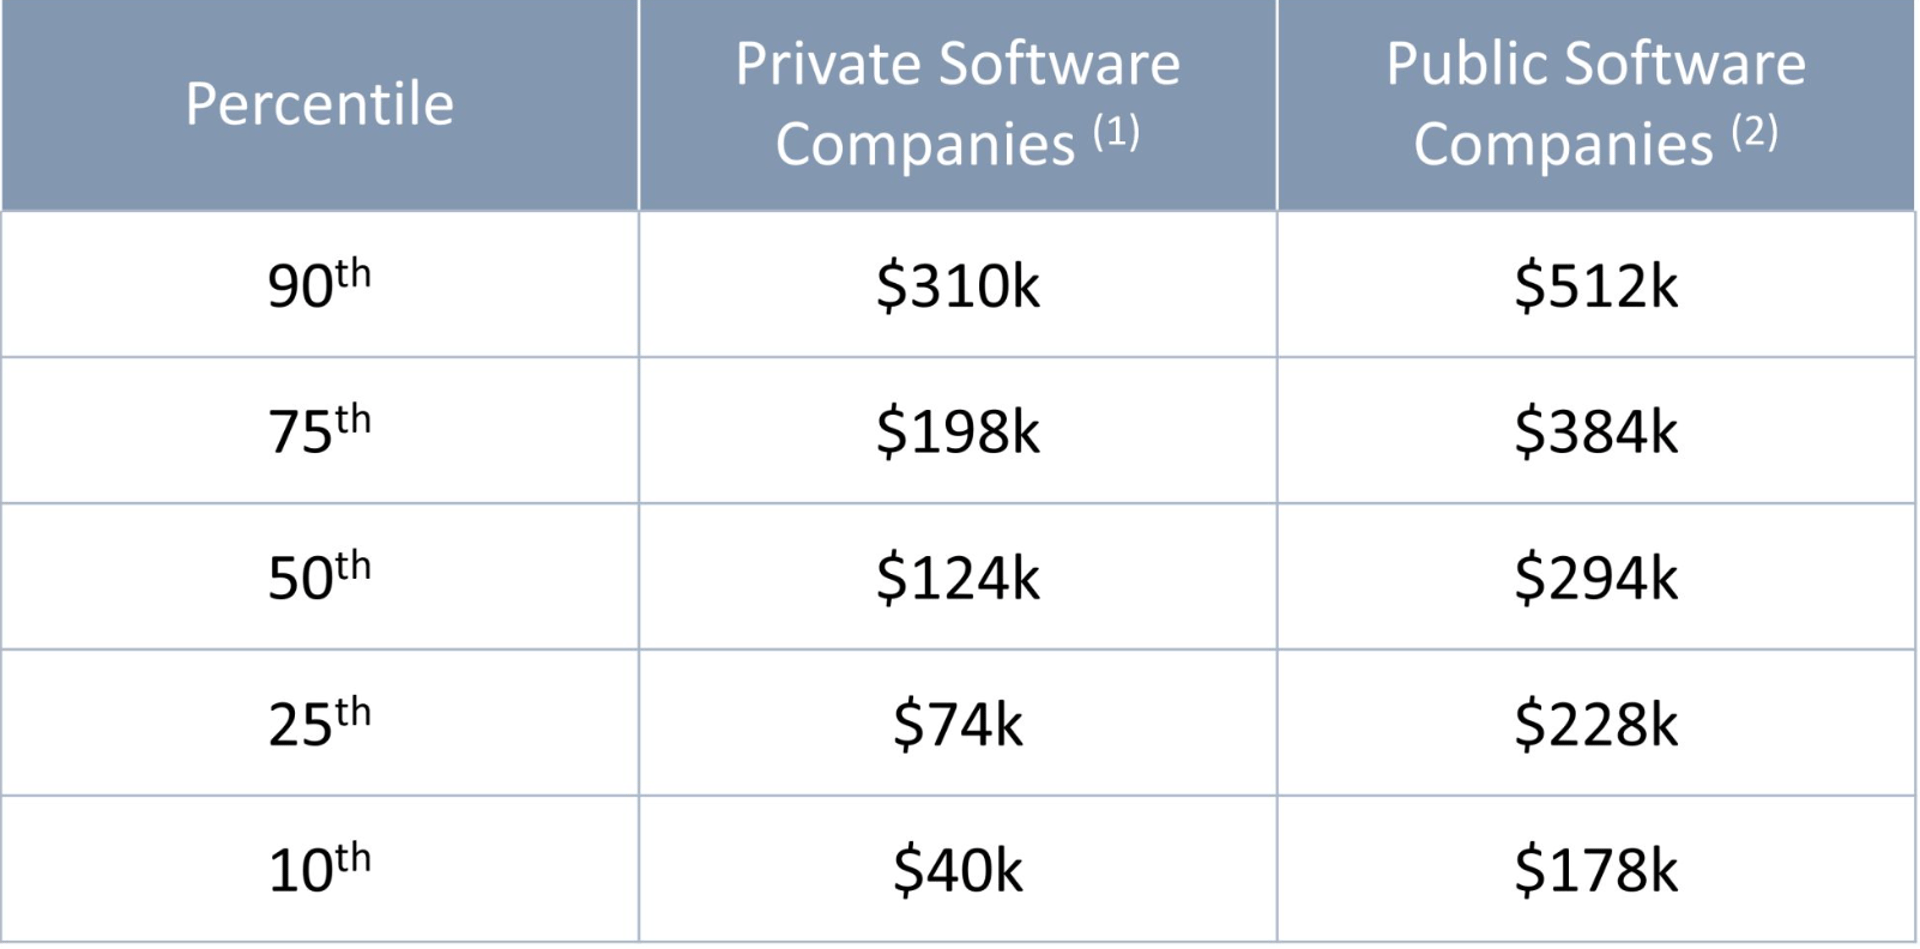
Revenue per Employee values for private software companies range between $40K and $310K. For public companies, these values are higher, ranging from $178K to $512K of revenue per employee. Revenue per Employee also varies by industry, with the Energy industry having the highest average revenue per employee of $1,790K.
Revenue per Employee benchmarks
Revenue per Employee. Private and public Software Companies.

How to visualize Revenue per Employee?
Compare your Revenue per Employee year-over-year to compare your most efficient performance periods to time periods that could be improved. Use this information to refine your hiring and staffing plan to reach the optimal Revenue to employee ratio. Take a look at the chart for an idea of what tracking your data could look like:
Revenue per Employee visualization example
Revenue per Employee

Bar Chart
Revenue per Employee
Chart
Measuring Revenue per EmployeeMore about Revenue per Employee
As an internal KPI, the Revenue to Employee ratio is often used alongside Profit per Employee and Expenses per Employee. Monitoring these metrics over time is a good way to track growth or decline in overall efficiency. However it should be noted that the revenue per employee metric is only loosely correlated with total revenue, growth rates or market caps (so, don't over rotate on this one!).
Note that this metric only looks at the number of employees and doesn’t account for labour costs. Refer to Payroll to Revenue Ratio, Gross Margin %, and, to some degree, Profit Margin % to get the complete story.
Revenue per Employee by Industry
Revenue per Employee Ratio varies by industry. The Energy sector has the largest revenue per employee by far, followed by Healthcare and Utilities, all with more than $800,000 revenue per employee. Software and technology companies have an average revenue to employee ratio of around $400K.
Not only will the Revenue to Employee ratio change from industry to industry, but geography, subsidies, and, of course, company revenue stage will all produce differences. Geography and subsidies, which have an impact on labour costs may allow a company to hire more employees and potentially invest less in automation. Early stage companies often have a very low and volatile Revenue to Employee ratio, until they see their investments produce predictable revenue.
Revenue per Employee Frequently Asked Questions
What does a low revenue per employee mean?
You might be in an industry that requires a high number of employees in proportion to your revenue. If your revenue per employee is low when compared industry benchmarks, it may indicate you need to revise your hiring practices. Conversely, high revenue per employee could indicate overworked employees.
What is a "good" Revenue per Employee figure?
This varies dramatically by industry. Capital-intensive industries like energy or telecommunications might exceed $500,000 per employee, while labor-intensive sectors like retail or hospitality might be closer to $100,000. Always benchmark against your specific industry peers rather than arbitrary targets.
Should we include contractors in our employee count?
This is a common source of inconsistency. For meaningful analysis, include full-time equivalents (FTEs) of all workers contributing to revenue generation, including contractors and part-time staff. Otherwise, companies can artificially inflate their metric by shifting to contractor-heavy models without actual efficiency improvements.
Our Revenue per Employee is declining - should we be concerned?
Not necessarily. This metric often dips during investment phases, such as when hiring ahead of anticipated growth or entering new markets. Context matters greatly - a temporary decrease while building capabilities may lead to stronger future performance. However, a sustained downward trend without strategic explanation warrants investigation.
How does this metric relate to profitability?
High Revenue per Employee doesn't always indicate high profitability. A consulting firm might generate substantial revenue per consultant but carry high compensation costs. Similarly, a manufacturing company might have lower revenue per employee but higher margins. Always examine this metric alongside profit margins for a complete picture of operational efficiency.