Viral coefficient is the number of new users or customers the average existing customer generates through referrals or sharing. A viral coefficient above 1 means each customer brings in more than one additional customer, compounding growth over time. It is used to measure organic growth momentum and to predict future customer acquisition velocity.
ƒ (Count(Number of Customers) * Average(Referrals per Customer) * Average(Conversion Rate for Referrals)) / 100
Assume your company runs a referral program. Out of your entire customer base, 5,000 customers each offer an average of 2 referrals, and the conversion rate on those referrals is 2%.
Viral Coefficient = (5,000 × 2 × 2) / 100 = 2
A viral coefficient of 2 means that for every new customer acquired, 2 more customers follow. Growth doubles with each referral cycle.
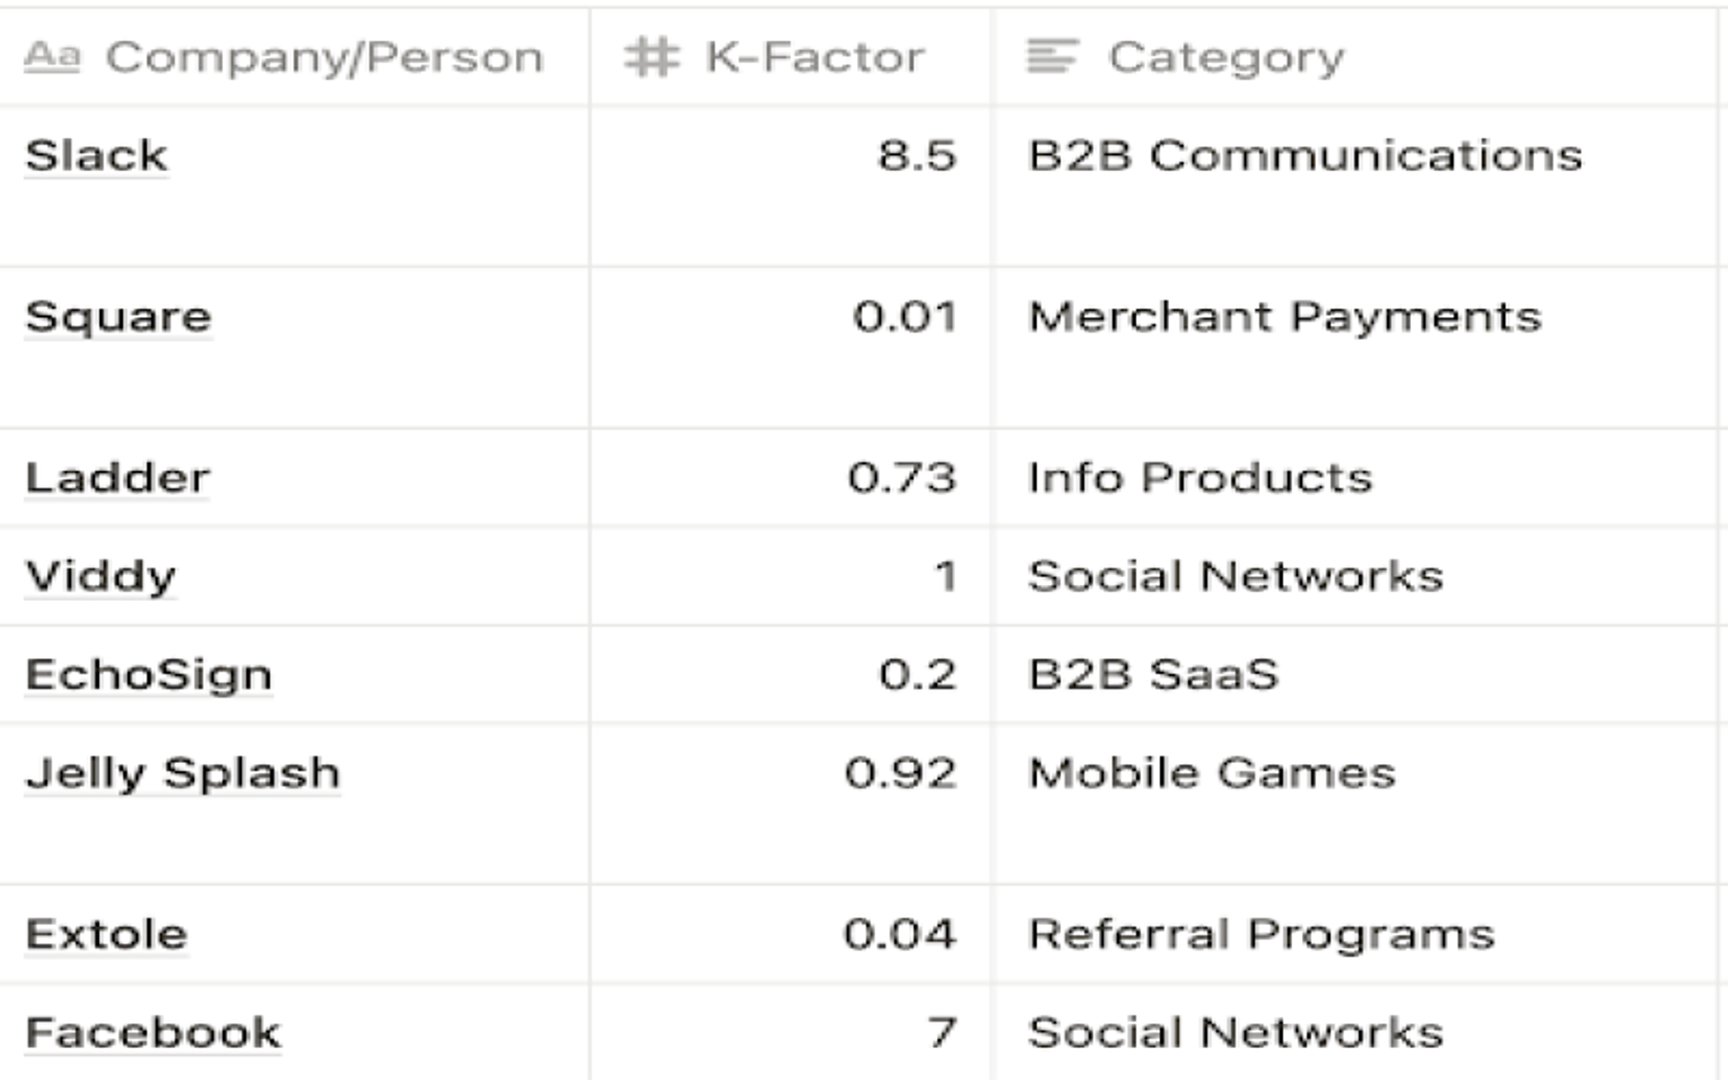
A viral coefficient above 1 indicates exponential growth. Most products operate between 0.1 and 0.5. Here are estimated K-Factor ranges for well-known businesses:
| Company | Estimated K-Factor |
|---|
| Facebook (early growth) | ~1.5–2.0 |
| Dropbox (referral program peak) | ~1.5+ |
| Hotmail | ~1.0+ |
| Typical SaaS product | 0.1–0.5 |
When tracking your Viral Coefficient metric, make sure you compare the current value to the past, to see how your virality has changed! A significant increase in the Viral Coefficient indicates your viral marketing strategy is succeeding.
Viral coefficient as a leading indicator
Viral coefficient is a leading indicator. It helps you predict the future velocity of your growth before the results show up in revenue or user counts. Paired with customer acquisition cost, it gives you a clearer picture of how efficiently your business can scale.
A rising viral coefficient signals that word-of-mouth momentum is building. A falling one is an early warning that product satisfaction or referral incentives may need attention.
Viral coefficient vs. Net Promoter Score
Viral coefficient is closely related to Net Promoter Score (NPS), but the two measure different things.
NPS captures intent: how likely a customer is to recommend you. Viral coefficient captures outcome: how many new customers actually convert from those recommendations.
A customer can give you a 10 on NPS and never refer anyone. Viral coefficient closes that gap by tying referral activity to actual conversion.
| Metric | What it measures | Type |
|---|
| NPS | Likelihood to recommend | Leading / sentiment |
| Viral coefficient | Referrals that convert | Leading / behavioural |
Track both together for a complete view of organic growth potential.
What viral coefficient doesn't tell you
Viral coefficient has real limits. It tells you how many new customers each existing customer generates, but it doesn't tell you:
How long the cycle takes. A viral coefficient of 1.5 looks great, but if each referral cycle takes six months, growth is slow in practice.
What your churn rate will be. High referral volume means nothing if acquired customers leave quickly.
Whether the referrals are genuine. If your viral coefficient is driven by a generous incentive rather than product love, it may not reflect sustainable demand.
Treat viral coefficient as one signal in a broader growth dashboard, not a standalone measure of health.
Scaling to match viral growth
If your viral coefficient climbs above 1, your growth can accelerate faster than your operations can handle. Onboarding, support, and infrastructure all need to scale in parallel. Companies that achieve strong virality but fail to support new customers often see satisfaction drop, churn rise, and the viral coefficient collapse shortly after.
Before pursuing viral growth aggressively, confirm that your customer experience holds up under volume.
Best practices for tracking viral coefficient
A few principles make viral coefficient more reliable and actionable:
Track referral cycles, not just totals. Measure how long each cycle takes to understand your actual growth velocity.
Separate organic from incentivized referrals. Incentive-driven referrals inflate the coefficient and may not reflect genuine product advocacy.
Segment by cohort. Viral coefficient often varies by customer segment, acquisition channel, or product tier. Cohort-level tracking reveals which customers are your best growth drivers.
Pair with conversion data. A high referral volume with a low conversion rate points to a messaging or onboarding problem, not a product problem.
Review regularly. Viral coefficient shifts with product changes, market conditions, and referral program design. Monthly tracking is a reasonable baseline.