What is Transaction Recency?
Transaction Recency is the average number of days since a customer's last purchase, measured across all repeat buyers. It indicates how quickly customers return to make additional purchases and is most useful for businesses where repeat transactions are expected, such as e-commerce, retail, and usage-based software.
Transaction Recency Formula
How to calculate Transaction Recency
You have 500 customers who made their first purchase last week. By the end of the week, 300 of those customers have made a repeat purchase — meaning 7 days have passed since their first transaction.
Transaction Recency = 7 / 300 = 2.3 days
On average, repeat customers return within 2.3 days. Whether that result is strong or weak depends on your industry and typical purchase cycle.
Start tracking your Transaction Recency data
Build and track this metric in PowerMetrics, a modern analytics platform that lets you define metrics and connect your own data.
Get PowerMetrics Free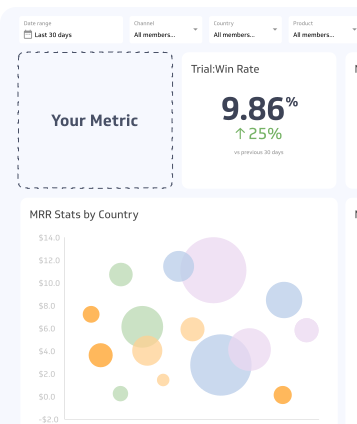
How to visualize Transaction Recency?
Transaction Recency is expressed as a number of days, so it is fitting to visualize this metric in a summary chart. This type of chat will let you display your current Transaction Recency value and compare it to a past time period.
Transaction Recency visualization example

Summary Chart
Here's an example of how to visualize your current Transaction Recency data in comparison to a previous time period or date range.
More about Transaction Recency
Why Transaction Recency matters
Recency is one of the three pillars of RFM analysis — Recency, Frequency, and Monetary value — a framework widely used to segment customers by behaviour. Customers who purchased recently are more likely to respond to outreach, convert again, and contribute to long-term revenue.
Tracking Transaction Recency helps you answer questions like:
- Are customers returning fast enough? A rising average signals disengagement before churn becomes visible in other metrics.
- Which segments are most active? Comparing recency across cohorts reveals which customer groups are most engaged.
- When should you reach out? Recency thresholds make a reliable trigger for re-engagement campaigns.
How to use Transaction Recency in practice
Trigger-based communications are one of the most direct applications. Set a recency threshold — for example, if a customer hasn't purchased in 14 days when your average is 5 — and trigger an automated "checking in" email, a discount offer, or a call centre follow-up. This keeps outreach timely rather than arbitrary.
Customer segmentation benefits from recency scoring. Rank customers by how recently they purchased and combine that score with purchase frequency and order value to identify your highest-value segments. Customers with high recency, high frequency, and high spend deserve different treatment than those who purchased once months ago.
Cohort analysis adds another layer. Tracking Transaction Recency across acquisition cohorts shows whether newer customers return faster than older ones — a useful signal when evaluating the impact of product changes, promotions, or onboarding improvements.
When Transaction Recency is and isn't the right metric
Transaction Recency works best when repeat purchases are discretionary and variable in timing. E-commerce, retail, marketplace, and usage-based models are natural fits.
It is less useful — or even misleading — in subscription billing models. If customers are billed monthly or annually on a fixed schedule, recency defaults to 30 or 365 days by design, not by behaviour. In those cases, metrics like Activation Rate or product engagement scores are better indicators of customer loyalty and retention risk.
Also consider purchase cycle length. A furniture retailer and a grocery app will have very different baseline recency values. Always interpret Transaction Recency relative to your expected purchase frequency, not as an absolute number.
Common challenges
Averaging across segments with different cycles can distort the metric. A customer who buys weekly and one who buys quarterly both count equally in a simple average. Segmenting before calculating gives a more accurate picture.
Recency alone doesn't explain why customers return or leave. Pair it with frequency and order value to distinguish high-value loyal customers from low-value frequent ones. Use qualitative signals — support tickets, NPS responses, session data — to understand the drivers behind recency trends.
Data freshness matters. Transaction Recency is only as accurate as your transaction data. Delayed syncs, missing records, or duplicate transactions will skew the average. Audit your data pipeline if recency values shift unexpectedly.
Transaction Recency Frequently Asked Questions
What is Transaction Recency?
Transaction Recency is the average number of days since a customer's last purchase, measured across all repeat buyers. It shows how quickly customers return to make additional purchases.
How is Transaction Recency calculated?
Divide the total count of days since each repeat customer's last transaction by the number of unique customers with more than one purchase.
When should I use Transaction Recency?
Transaction Recency is most useful for businesses where repeat purchases are discretionary, such as e-commerce, retail, and usage-based software. It is less meaningful for subscription models where billing cycles are fixed.
What is a good Transaction Recency value?
There is no universal benchmark. A good value depends on your industry and expected purchase cycle. Compare your Transaction Recency against your own historical average and against similar businesses in your sector.