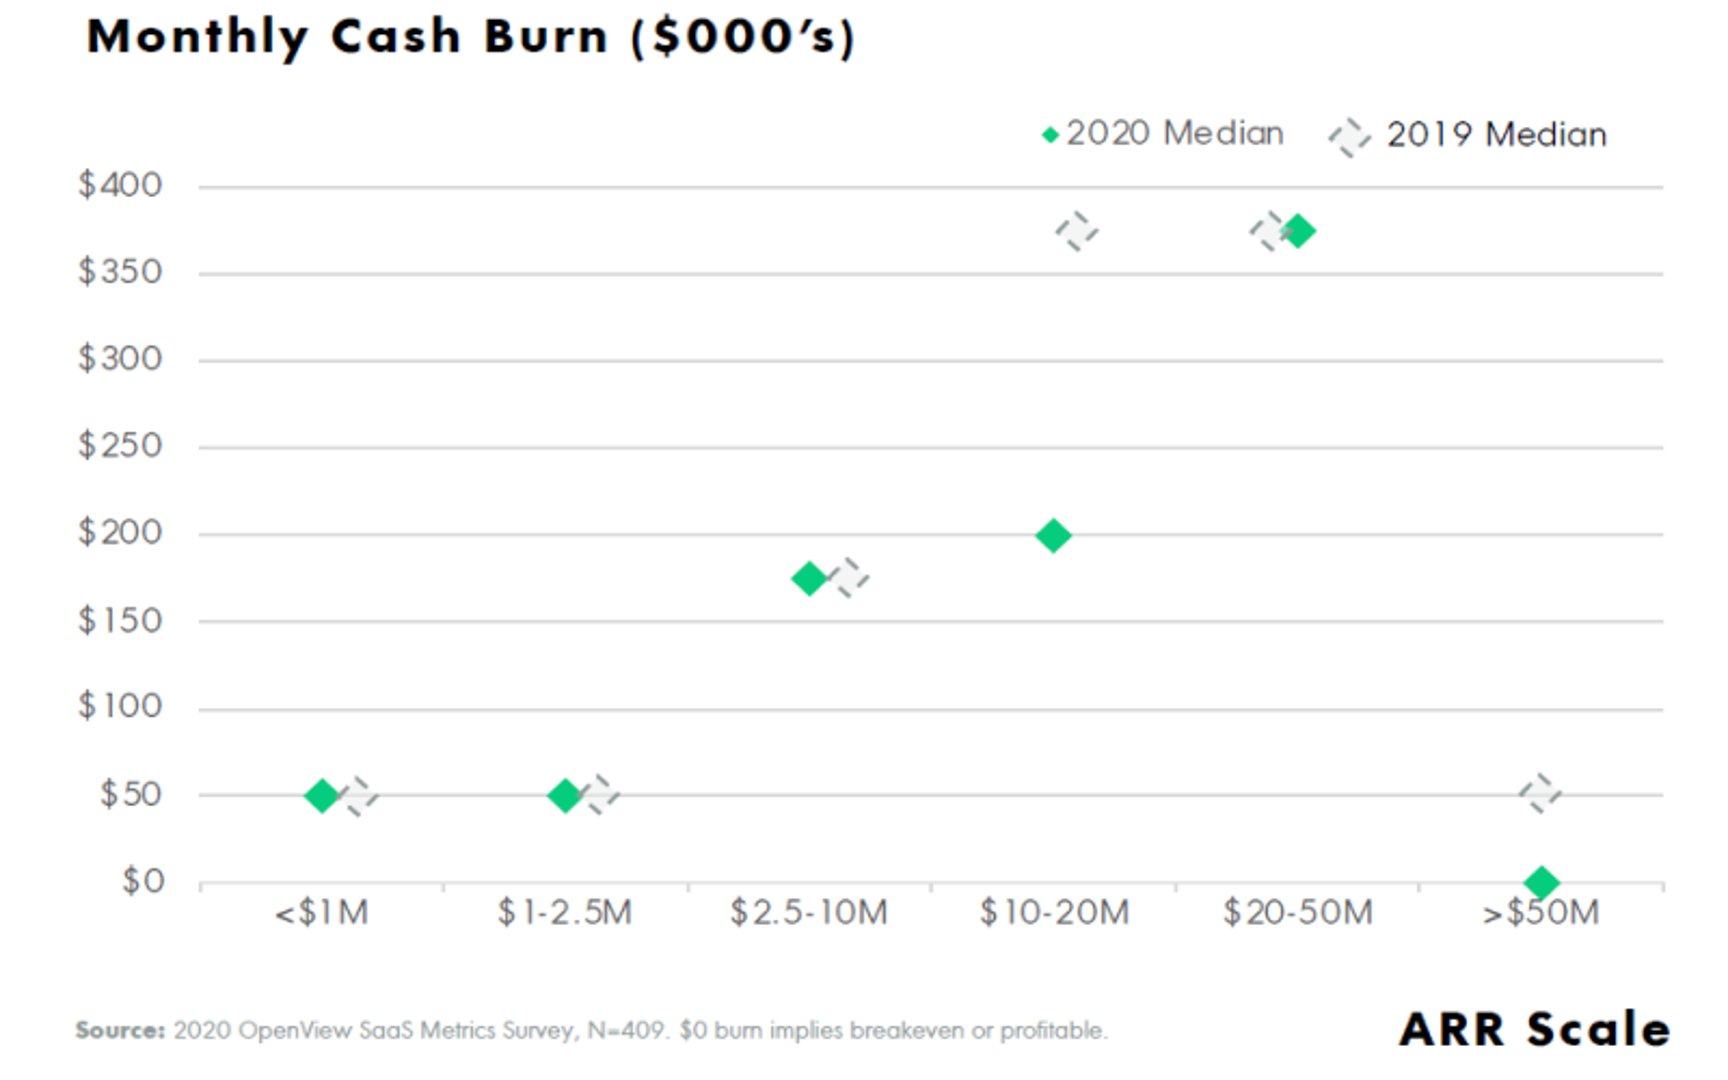
The median monthly cash burn is $175K for companies making between $2.5M and $10M ARR.
Gross Burn
Last updated: Oct 12, 2022
What is Gross Burn?
A company's Gross Burn is the total cash spent on operations. These costs typically include all salaries, rent, and other overhead as well as interest and taxes. This metric is often confused with Net Burn, which is a measure of negative cash flow, and includes revenue and expenses.
Alternate names: Operating ExpensesGross Burn Formula
ƒ (COGS + Salaries and Overhead + Depreciation and Amortization + Other Operating Expenses + Interest and Taxes)
Start tracking your Gross Burn data
Use PowerMetrics, modern analytics platform, to monitor your data. Choose a service below to start tracking your Gross Burn instantly.

What is a good Gross Burn benchmark?
Gross Burn benchmarks

How to visualize Gross Burn?
Use a summary chart to visualize your Gross Burn data and compare it to a previous time period.
Gross Burn visualization example

Summary Chart
Here's an example of how to visualize your current Gross Burn data in comparison to a previous time period or date range.
Gross Burn
Chart
Measuring Gross BurnMore about Gross Burn
Gross Burn includes expenses such as manufacturing costs, salaries, contractors, sales commissions, employee benefits, marketing and advertising, transportation and travel, amortization and depreciation, rent, repairs, and taxes.
In most cases, Gross Burn is reported as a monthly number.